What Ray Dalio’s ‘bubble indicator’ says about the Magnificent Seven
With so many folks warning about a rerun of tech’s 1990s dot-com bust, Reda Farran decided to consult the hedge fund billionaire’s ‘bubble indicator’.
8th March 2024 09:30
by Reda Farran from Finimize

- Ray Dalio has seen a few bubbles over his 50-year-plus investing career. So he developed a “bubble indicator” that uses six questions to help determine whether stock prices are unsustainably high.
- Based on the Dalio indicator, US stocks are currently sitting in the 52nd percentile, meaning they’re not in a bubble. The measure suggests the Magnificent Seven stocks appear to be a bit frothy, but not so much to suggest an outright bubble.
- With the measure not indicating any extremes, it’s hard to infer any specific investment actions from it. But the fact that it suggests that US stocks and the Magnificent Seven aren’t in bubble territory just might be a little reassurance about staying invested.
Ray Dalio – the billionaire founder of the world’s biggest hedge fund – is known for many things, but his “bubble indicator” is a particular masterpiece. It uses six questions to help determine whether stock prices are unsustainably high. And given the frequent comparisons between the Magnificent Seven and the 1990s dot-com boom and bust, it seems like a good time to check in with that gauge.
Here are the Ray Dalio Bubble Indicator’s Six Big Questions.
1) How high are stock prices relative to traditional valuation measures, like earnings-per-share or book-value-per-share?
This question gets right to the fundamentals. Right now, stock valuations are above average, currently sitting in the 73rd percentile relative to their history. Looking at the Magnificent Seven specifically, the group seems fairly priced overall. But there’s a range. Alphabet and Meta appear cheap, whereas Tesla and Apple look somewhat expensive. Nvidia, Amazon, and Microsoft seem fairly priced.
2) Are prices discounting unsustainable conditions?
To answer this question, you have to weigh up the corporate earnings growth rate that’s required for stocks to outperform bonds. This measure has gone up over the past two years because bond yields have risen, which jacks up the hurdle for stock returns, and so it’s now in the 67th percentile for US shares. In other words, the future earnings growth currently being discounted in stocks is a bit high. And this is even more noticeable for the Magnificent Seven, because of the elevated expectations around AI.
3) How many new buyers have entered the market lately?
A rush of new entrants, especially smaller players attracted by fast-rising prices, is often telling. This gauge shot above the 90th percentile in 2020 as retail investors stampeded into much-hyped stocks. Many of those players continue to be active in the market, but fewer newcomers are charging through the doors, compared to those heady Covid-era days. Today, this particular indicator is in the 55th percentile – nothing particularly raucous. And while trading in the Magnificent Seven is still near all-time highs in dollar terms, it’s utterly humdrum when expressed as a percentage of their market capitalizations.
4) How broadly positive is investor sentiment?
If it’s too bullish, many investors may have already invested everything they’ve got – meaning they’re more likely to be sellers than buyers. That’s not the case today, with market sentiment neutral to slightly positive. Attitudes toward AI and AI-linked stocks, though, are quite bullish. That could spell trouble for investors if the technology doesn’t live up to the hype.
5) Are investments being financed by high leverage?
Buyers who draw heavily on either margin (borrowed money) or leveraged products like options are more vulnerable to forced selling in a downturn. As things stand, the US market looks healthy overall, with this measure lying in the modest 23rd percentile.
6) Are businesses investing in their futures?
Company spending on things like equipment and factories can reveal whether stock market optimism has infected the real economy, creating potentially unrealistic (and expensive) expectations of demand growth. This gauge is currently in the 38th percentile, or slightly lower than average. Capital expenditures by the Magnificent Seven, however, are at all-time highs, both as a percentage of their own sales and as a share of the size of the economy. And, yes, that could suggest frothy conditions, but it could also simply reflect heavy spending on data centers to meet the burgeoning demand for AI, cloud computing, and more.
Here’s what the bubble gauge tells you.
The chart below shows the composite bubble measure for US stocks since 1900, expressed using percentiles. Simply put, the higher the reading, the more the indicator implies a market bubble. US shares are currently sitting in the 52nd percentile, despite a pretty muscular rally over the past 17 months. This suggests that they’re not in a bubble.
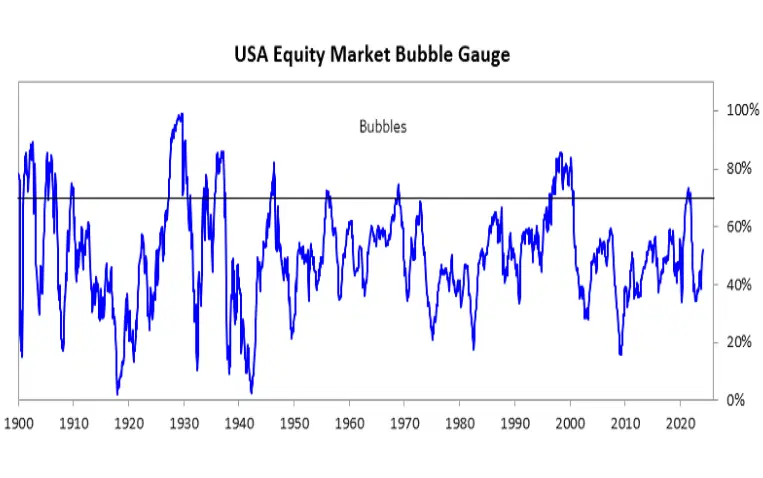
The bubble indicator on US stocks is sitting at the 52nd percentile. Source: Bridgewater Associates.
Looking at the same dial for the Magnificent Seven, these big tech companies do appear to be a bit frothy, but not so much to suggest an outright bubble. Valuations are slightly expensive given current and projected earnings, sentiment is bullish but not excessively so, and there isn’t disproportionate leverage or a flood of new and naïve buyers rushing toward these stocks. Having said that, they could still see a hefty correction if generative AI doesn’t live up to the hype that’s priced in, especially considering that they’re plowing boatloads of money into the technology.
And, finally, what it might mean for you.
With the measure not indicating any extremes, it’s hard to infer any specific investment actions from it. If Dalio’s indicator had said that US shares are in an outright bubble, then that might’ve been your cue to trim your stock exposure or exit the market altogether. But the fact that it’s in the 52nd percentile is probably just a little reassurance about staying invested (that is, if you were worried about a bubble forming in the first place).
As the old adage in the investing world goes, success isn’t about timing the market, but time in the market. Put differently, trying to predict the exact moment when the market will turn is a recipe for losses – even if you use valuation metrics as entry and exit signals.
As for those Magnificent Seven, well, sure, the firms have seen their market capitalizations explode over the past decade, but this surge has gone hand-in-hand with fast-rising earnings (see the chart below). That’s a much healthier scenario compared to the dot-com bubble era when tech stocks saw meteoric rises without the earnings to back them up.
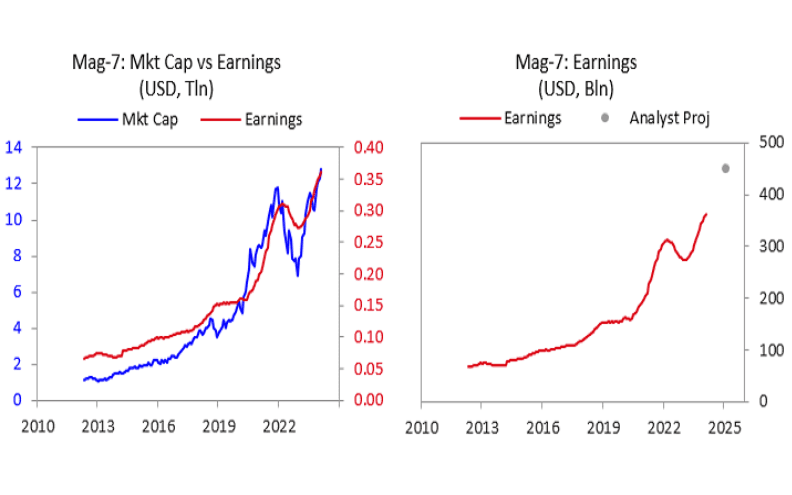
The combined market capitalization of the Magnificent Seven has grown by and large in line with earnings. Source: Bridgewater Associates.
So, like the conclusion above, if you’re invested in these tech names and are worried about potential frothiness or echoes of the dot-com bubble, you can rest assured this doesn’t appear to be the case today. That is, as long as AI doesn’t fail to live up to its great hype.
Reda Farran is an analyst at finimize.
ii and finimize are both part of abrdn.
finimize is a newsletter, app and community providing investing insights for individual investors.
abrdn is a global investment company that helps customers plan, save and invest for their future.
These articles are provided for information purposes only. Occasionally, an opinion about whether to buy or sell a specific investment may be provided by third parties. The content is not intended to be a personal recommendation to buy or sell any financial instrument or product, or to adopt any investment strategy as it is not provided based on an assessment of your investing knowledge and experience, your financial situation or your investment objectives. The value of your investments, and the income derived from them, may go down as well as up. You may not get back all the money that you invest. The investments referred to in this article may not be suitable for all investors, and if in doubt, an investor should seek advice from a qualified investment adviser.
Full performance can be found on the company or index summary page on the interactive investor website. Simply click on the company's or index name highlighted in the article.