10 sector-beating stocks in an uncertain market
Ben Hobson screens the stock market for the best performers across the the main sectors this year.
29th July 2020 14:36
by Ben Hobson from Stockopedia
Share on
Ben Hobson screens the stock market for the best performers across the the main sectors this year.

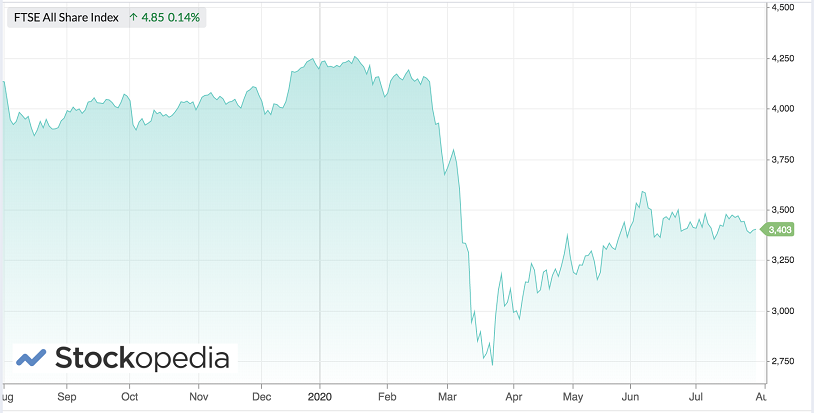
It’s remarkable to think that six months ago, as January was drawing to a close, the FTSE All-Share index was flirting with a 52-week high. Back then, we were only starting to feel the full extent of the Covid-19 pandemic. And today, the index is still nearly 17% down on where it was.
One of the interesting trends that unfolded as uncertainty swept through markets and economies, is how stocks in different industry sectors have performed.
In this column we regularly talk about portfolio theory and the textbook teachings on why you should spread exposure around. Conventional thinking says too much weight in just a few sectors can leave you stranded when things turn sour. But it’s perhaps only when you see those concepts play out for real that the penny really drops.
Sector diversification 101
On the map of the stock market, there are three main super-sectors: Cyclicals, Defensives and Sensitives, and divided between them are 10 ‘country-like’ sectors…
- Cyclicals: Basic Materials, Consumer Cyclicals, Financials
- Defensives: Healthcare, Consumer Defensives, Utilities
- Sensitives: Industrials, Energy, Telecoms, Technology
In general, Cyclical sectors are the most sensitive to macro trends and the health of the economy. They include high street retailers and housebuilders. These industries did well in the years after the financial crisis but they’re first on the chopping block when the economy dives.
Defensives, on the other hand, tend to be less reliant on the domestic economy because they sell goods that are in constant demand. Think grocery chains, pharma companies and utilities. In stable conditions, these stocks can look dull and they don’t move fast enough for many investors.
With this in mind, here’s a view of the performances of the main sectors, relative to the overall market, over the past six months.
| Name | PE Ratio | Relative Price Strength (6m) |
|---|---|---|
| Healthcare | 23.6 | 21.5 |
| Basic Materials | 12.5 | 18.2 |
| Technology | 26.6 | 16.6 |
| Utilities | 14.4 | 15 |
| Consumer Defensives | 14.1 | 10 |
| Telecoms | 10.9 | 9.81 |
| Financials | 11.9 | 2.78 |
| Industrials | 11.3 | -7.37 |
| Energy | 7.62 | -17.4 |
| Consumer Cyclicals | 11.1 | -20.5 |
Behind the scenes there are a few moving parts, but the clear trend here is that more defensive sectors like healthcare, tech, utilities and consumer defensives have done much better than consumer cyclicals, energy (including oil and gas) and industrials over the period. As advertised, they’ve offered at least some defence in very unsettled conditions.
You can take this further and look at the best and worst performances in the 54 industry groups that make up the 10 main sectors:
| Name | PE Ratio | Relative Price Strength (6m) |
|---|---|---|
| Renewable Energy | - | 153.3 |
| Diversified Trading & Distribution | 15.2 | 83.6 |
| Diversified Retail | 25.8 | 48.6 |
| Biotechnology & Medical Research | 32.1 | 48.1 |
| Uranium | 15.3 | 45.6 |
| Metals & Mining | 10.9 | 29.4 |
| Hotels & Entertainment Service | 13.8 | -27.9 |
| Office Equipment | - | -30.6 |
| Aerospace & Defense | 16 | -31.2 |
| Textiles & Apparel | 10.9 | -33.6 |
| Passenger Transportation Services | 5.08 | -54 |
At the industry level, average performances are very dependent on the numbers of companies in each group and they can be skewed by outsize gains in a handful of stocks. But in terms of trends, you can see that certain retailers, biotech, and mining (particularly gold mining) have led the pack. Meanwhile, passenger transport (including bus and train firms), clothes retailers, office supplies and entertainment have suffered badly on average.
To take this one final step, here are the best performing stocks from each of the main sectors in the market on a six-month relative price strength basis (and with a minimum market cap of £100 million). In these challenging times, the big winners at the individual stock level have been small-cap biotech and mining companies, although most sectors have had some exceptional leading performers in a falling market.
| Name | Mkt Cap £m | Relative Price Strength (6m) | Sector |
|---|---|---|---|
| Synairgen (LSE:SNG) | 322.8 | 2,671 | Healthcare |
| Eurasia Mining (LSE:EUA) | 482.3 | 493.9 | Basic Materials |
| PowerHouse Energy (LSE:PHE) | 122.7 | 465.7 | Energy |
| BATM Advanced Communications (LSE:BVC) | 605.4 | 278.7 | Technology |
| Premier Foods (LSE:PFD) | 729.5 | 179.9 | Consumer Defensives |
| CMC Markets (LSE:CMCX) | 942.5 | 147.8 | Financials |
| Gear4music Holdings* (LSE:G4M) | 106.8 | 128.7 | Consumer Cyclicals |
| Proton Motor Power Systems (LSE:PPS) | 471.9 | 112 | Industrials |
| ContourGlobal (LSE:GLO) | 1,386 | 30.6 | Utilities |
| Gamma Communications (LSE:GAMA) | 1,438 | 29.8 | Telecoms |
Stockopedia. Based on six-month relative strength to 28 July 2020
*The leading Consumer Cyclicals performer was Best of the Best plc (+337.5%), which is currently subject to a takeover
Overall, trends over the past six months have been a stark illustration of how the market quickly recalibrates its view of different sectors when the economic conditions change. And if a portfolio is too heavily concentrated in what turn out to be bad sector bets, then the outcome can be painful. It’s a reminder that predicting the future is futile and one of the best hedges against the unknown is diversification.

Stockopedia helps individual investors beat the stock market by providing stock rankings, screening tools, portfolio analytics and premium editorial. The service takes an evidence-based approach to investing, and uses the principles of factor investing and behavioural finance to help investors make better decisions.
interactive investor readers can get a free 14-day trial of Stockopedia by clicking here.
These investment articles are simply for generating ideas. If you are thinking of investing they should only ever be a starting point for your own in-depth research.
interactive investor readers can get a free 14-day trial of Stockopedia here.
These investment articles are simply for generating ideas. If you are thinking of investing they should only ever be a starting point for your own in-depth research.
These articles are provided for information purposes only. Occasionally, an opinion about whether to buy or sell a specific investment may be provided by third parties. The content is not intended to be a personal recommendation to buy or sell any financial instrument or product, or to adopt any investment strategy as it is not provided based on an assessment of your investing knowledge and experience, your financial situation or your investment objectives. The value of your investments, and the income derived from them, may go down as well as up. You may not get back all the money that you invest. The investments referred to in this article may not be suitable for all investors, and if in doubt, an investor should seek advice from a qualified investment adviser.
Full performance can be found on the company or index summary page on the interactive investor website. Simply click on the company's or index name highlighted in the article.