Chart of the week: Are Barclays shares about to rocket?
Selling pressure is drying up and a selling climax could set the stage for a huge rally phase.
9th September 2019 11:03
by John Burford from interactive investor
Selling pressure is drying up and a selling climax could set the stage for a huge rally phase.

Is Barclays set up for a solid recovery now?
Long-time readers will know that I have been steadfastly bearish on UK bank shares for a very long time with Lloyds Banking Group (LSE:LLOY) and Barclays (LSE:BARC) to the bearish fore. My stance has paid dividends (but not literally!) as short positions have been well rewarded. But is it time to re-assess and even consider taking a bullish stance?
One of the major constraints on the banks has been the minuscule spread margins they have been allowed to make on loans, mortgages, and so on. The mainstream media is full to brimming of the dire effects of the margin squeeze highlighted by the infamous 'yield inversions' in US Treasuries. Bearish sentiment towards 'lower for longer' interest rates is running at fever pitch.
The conventional 'wisdom' of the pundits has it that because major economies are slowing, interest rates can only go lower as central banks are being forced into applying more 'stimulus'. But what if they are wrong and that market forces are already on the turn? I have shown before that the US Federal Reserve, for instance, only reacts to rate changes as dictated by the market – it never leads. And most other central banks take their cues from the Fed. This fact is lost on most economists and analysts.
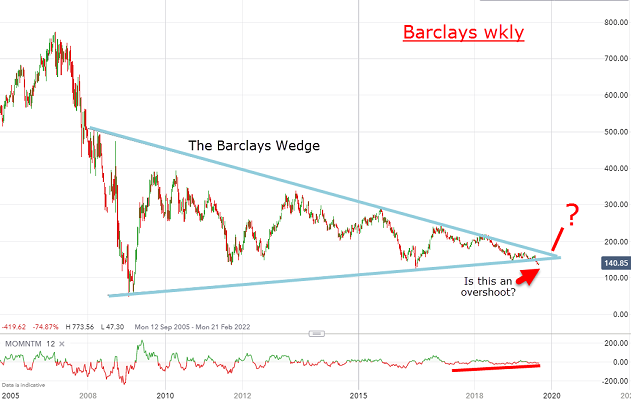
Here is the long-term weekly chart for Barclays showing the wonderful Barclays Wedge:

Source: interactive investor Past performance is not a guide to future performance
How the mighty have fallen! At the end of August, the shares made a two-year low at 135p, which is not far off a new 10-year low. Ouch! But there are two important features here – first, the large momentum divergence in force for three years and second, the potential ‘overshoot’ of the lower Wedge line.
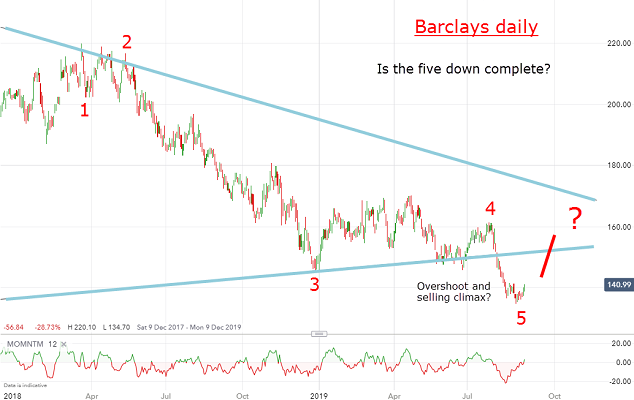
The momentum divergence is a clue that selling pressure is drying up and the overshoot – if it comes off – an indication that last week saw a selling climax that sets the stage for a huge rally phase. Here is a close-up of recent action:

Source: interactive investor Past performance is not a guide to future performance
From the latest hit on the upper Wedge line, the market has descended in five Elliott waves (that may or may not be complete). Remember, fifth waves are ending waves prior to a reversal.
This sets the scene for a reversal of fortune – just as bullish sentiment is on the floor (after months of a big bear phase). We are seeing a plethora of media articles explaining why the shares 'fell 11% in August' to add to the gloom, and why the PPI pay-outs could be much greater that thought. In addition, both Lloyds Banking Group and Barclays are now being downgraded by analysts – a comforting thought for we merry band of contrarians!
For those reasons, I have been covering short positions for major profits. I am also taking small long positions here using the recent low as my fail-safe. If that low holds and the shares can climb back above the 170p area inside the Wedge, the 'overshoot' would be genuine – and herald a swift rally up to the 170p area with higher potential.
Finally, the European Central Bank (ECB) meets on Thursday this week, and most expect it to lower its policy rate below the minus 0.4% currently prevailing in order to juice the flagging eurozone economy. But what if they make no changes, or just a small adjustment? Eurozone bond yields should go nuts (to the upside) – and EU and UK banks rocket.
For more information about Tramline Traders, or to take a three-week free trial, go to www.tramlinetraders.com.
John Burford is the author of the definitive text on his trading method, Tramline Trading. He is also a freelance contributor and not a direct employee of interactive investor.
These articles are provided for information purposes only. Occasionally, an opinion about whether to buy or sell a specific investment may be provided by third parties. The content is not intended to be a personal recommendation to buy or sell any financial instrument or product, or to adopt any investment strategy as it is not provided based on an assessment of your investing knowledge and experience, your financial situation or your investment objectives. The value of your investments, and the income derived from them, may go down as well as up. You may not get back all the money that you invest. The investments referred to in this article may not be suitable for all investors, and if in doubt, an investor should seek advice from a qualified investment adviser.
Full performance can be found on the company or index summary page on the interactive investor website. Simply click on the company's or index name highlighted in the article.
Disclosure
We use a combination of fundamental and technical analysis in forming our view as to the valuation and prospects of an investment. Where relevant we have set out those particular matters we think are important in the above article, but further detail can be found here.
Please note that our article on this investment should not be considered to be a regular publication.
Details of all recommendations issued by ii during the previous 12-month period can be found here.
ii adheres to a strict code of conduct. Contributors may hold shares or have other interests in companies included in these portfolios, which could create a conflict of interests. Contributors intending to write about any financial instruments in which they have an interest are required to disclose such interest to ii and in the article itself. ii will at all times consider whether such interest impairs the objectivity of the recommendation.
In addition, individuals involved in the production of investment articles are subject to a personal account dealing restriction, which prevents them from placing a transaction in the specified instrument(s) for a period before and for five working days after such publication. This is to avoid personal interests conflicting with the interests of the recipients of those investment articles.