Chart of the week: Are HSBC shares racing to a fiver?
15th October 2018 10:39
by John Burford from interactive investor
Share on
Technical analyst John Burford has spotted a pattern that suggests shares in the world's local bank could fall 20% very quickly. Here's his thinking.

HSBC forms a Head & Shoulders top
With the FTSE 100 breaking through the thin ice I mentioned last week – it was down 300 points on the week – my prediction for the financials to lead the way lower is coming to pass. We are seeing a repeat of the 2007/2008 scenario which lead to the Credit Crunch as credit suddenly contracted.
All things being equal, one would expect banks' income would increase as rates and margins rise and share values would improve. Sadly, in the real world, with rates coming off easy money near-zero rates, loan demand falls off and borrowers are inclined to pay off existing debt, rather than take on new. The stalling UK real estate market here is testament to this economic law.
So today I will focus on one of the major banks, HSBC.
Previously, I have covered Lloyds which remains in a severe downtrend. But HSBC is a different animal as it has extensive Far East operations. After all, 'H' stands for Hong Kong and 'S' for shanghai! Until recently, this region was considered the saviour of global economic growth in which HSBC was destined to play a considerable role.
That sentiment led to the bull market from the May 2016 lows around £4 to the £8 high in January.
Of course, no bullish story no matter how plausible remains unchallenged for long. Earlier this year, doubts were growing of the perpetual China growth theme and HSBC shares suffered a set-back to the £6.50 area. There, the Dip Buyers came out in full force and pushed the shares up to the £7.50 level.
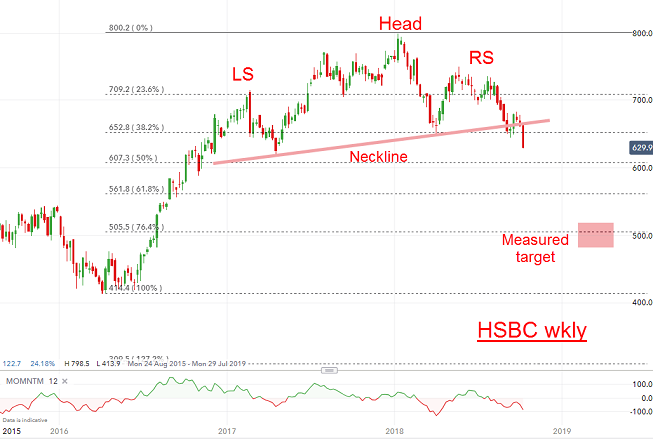
That was where I started to look for a short trade. Here is the weekly chart:
Source: interactive investor Past performance is not a guide to future performance
I had already drawn in the pink trendline and reckoned that if the shares retreated back to that line, it would set up a nice Head & Shoulders reversal pattern - provided the market could break decisively through that pink line of support.
And that is precisely what it did last week with the plunge down to the £6.30 level.
So now I have a confirmed H&S reversal (provided the shares do not rise back up above the £6.80 area) and can use the Measured Target Rule* to project an immediate goal at the £5 area.
Also, if the shares are in a third wave down, that journey should be accomplished fairly rapidly.
*For chart technicians, this is a very well-known rule. It states that the minimum target is obtained by measuring the height of the Head above the neckline and applying that to the distance below the neckline break to the target.
John Burford is the author of the definitive text on his trading method, Tramline Trading. He is also a freelance contributor and not a direct employee of interactive investor.
These articles are provided for information purposes only. Occasionally, an opinion about whether to buy or sell a specific investment may be provided by third parties. The content is not intended to be a personal recommendation to buy or sell any financial instrument or product, or to adopt any investment strategy as it is not provided based on an assessment of your investing knowledge and experience, your financial situation or your investment objectives. The value of your investments, and the income derived from them, may go down as well as up. You may not get back all the money that you invest. The investments referred to in this article may not be suitable for all investors, and if in doubt, an investor should seek advice from a qualified investment adviser.
Full performance can be found on the company or index summary page on the interactive investor website. Simply click on the company's or index name highlighted in the article.
Disclosure
We use a combination of fundamental and technical analysis in forming our view as to the valuation and prospects of an investment. Where relevant we have set out those particular matters we think are important in the above article, but further detail can be found here.
Please note that our article on this investment should not be considered to be a regular publication.
Details of all recommendations issued by ii during the previous 12-month period can be found here.
ii adheres to a strict code of conduct. Contributors may hold shares or have other interests in companies included in these portfolios, which could create a conflict of interests. Contributors intending to write about any financial instruments in which they have an interest are required to disclose such interest to ii and in the article itself. ii will at all times consider whether such interest impairs the objectivity of the recommendation.
In addition, individuals involved in the production of investment articles are subject to a personal account dealing restriction, which prevents them from placing a transaction in the specified instrument(s) for a period before and for five working days after such publication. This is to avoid personal interests conflicting with the interests of the recipients of those investment articles.