Chart of the week: Is this bank about to be hit for six?
20th August 2018 14:10
This high-profile lender has done exactly what technical analyst John Burford predicted. Here's how, with an indication of what could happen next.

Standard Chartered follows my roadmap (after a glitch)
I was surprised to learn that the last time I covered this share was back in December 2017 where I was very negative on it. Regular readers will know that I have been a perma-bear on UK banks for a very long time.
Since December, the shares have been in a large consolidation zone, but is now breaking clear and following the precise scenario I painted then.
• Chart of the week: A FTSE 100 bank trade
• UK banks: A review and what's in store for 2018
To recap, this was the weekly chart I posted on 4 December:
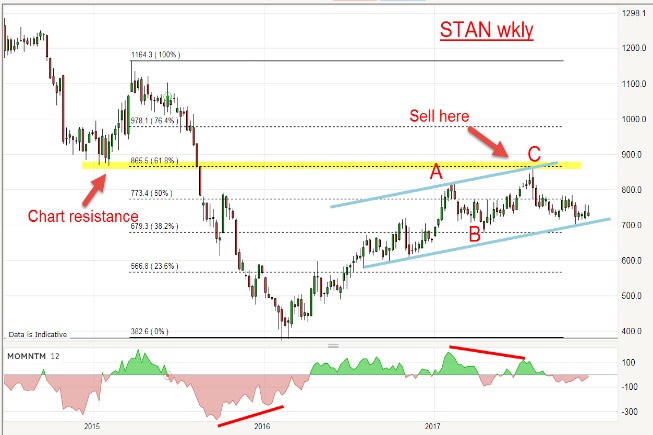
Source: interactive investor Past performance is not a guide to future performance
I noted that the rally off the 2016 low was in the form of an A-B-C (which is always corrective to the main trend) and the C wave was set on a large momentum divergence (red bar) that told me the buying power was drying up and to prepare for a resumption of the main downtrend.
That duly arrived and, as of 4 December, I had short trades working: and this is what I wrote:
"To sum up: we have had at least three excellent low risk shorting opportunities since August 31 – at the 860, 780 and 750 levels. All are in profit to date."
And, disappointingly, right after that, the market pushed back up one more time towards the 860p resistance level. So that presented me with a few headaches.
Different traders would react in different ways to such a reversal of fortune.
Some would just sit on their shots and wait for the market to (hopefully) turn back down (which it did in February). That is perhaps fine when investing with cash, but not so when spread betting with the enhanced leverage employed.
One technique I use in spread betting is to set covering buy stops if certain levels are breached on the upside. The worst-case scenario is to escape with net zero loss – a most satisfactory outcome in the circumstances. But, if nimble enough, you can at least take some profits on the campaign.
It became pretty obvious the market was not going to resume its bear trend at the time, so evading action is usually the prudent course.
But, after the 860p re-test, the market resumed its decline once more and there were several opportunities to reinstate short trades again, principally at the 780p area.
And this is the current picture:
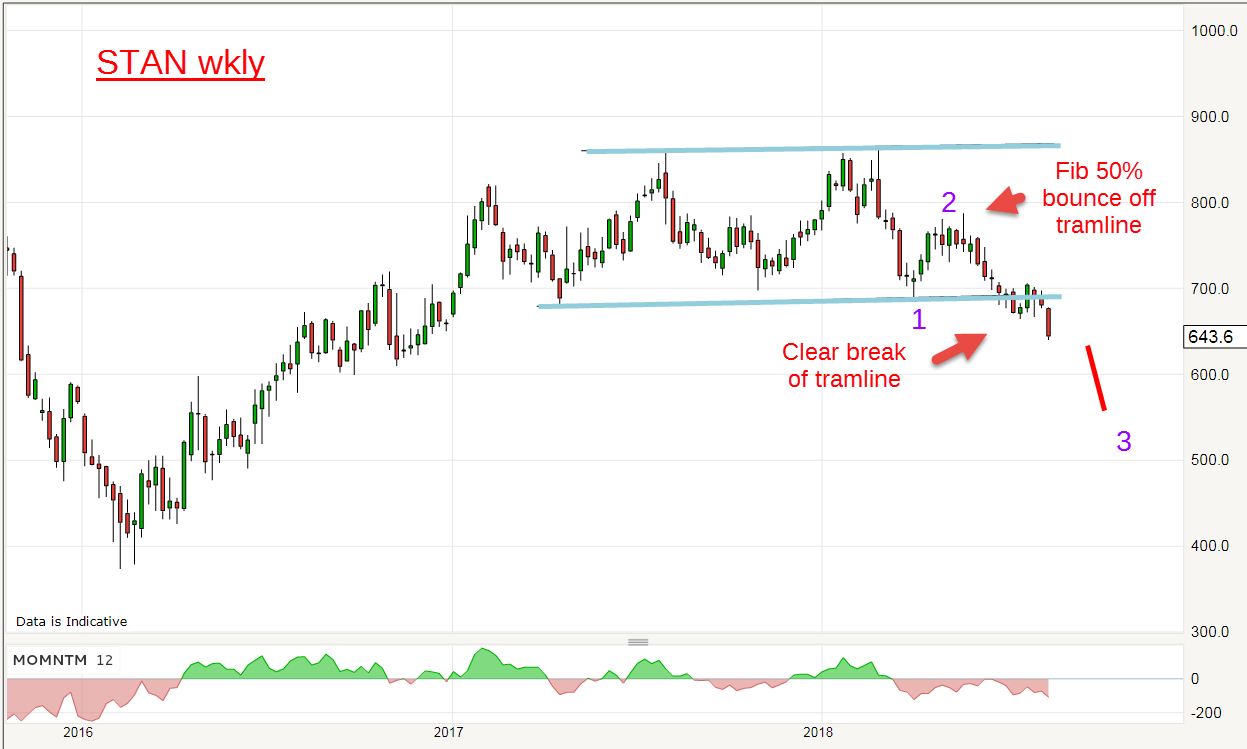
Source: interactive investor Past performance is not a guide to future performance
I now have amended my tramline placement to make a better fit on the highs and lows and in April, after a sharp decline, the market met the lower tramline in the 700p area and then staged a bounce to the Fibonacci 50% retrace at 780p where a low-risk short trade was entered.
The market then retreated back to the lower tramline support, and last month engaged in a severe and lengthy test of the strength of the support there. But last week that support finally gave way and the market made a clear break down.
This is what I concluded in December:
"My best guess is that the shares will continue lower after perhaps a small bounce and a break of the lower blue tramline in the 700 area would really knock STAN for six."
After an intervening rally phase, the market traded down to 640p last week, making that forecast eight months ago entirely correct.
John Burford is the author of the definitive text on his trading method, Tramline Trading. He is also a freelance contributor and not a direct employee of interactive investor.
These articles are provided for information purposes only. Occasionally, an opinion about whether to buy or sell a specific investment may be provided by third parties. The content is not intended to be a personal recommendation to buy or sell any financial instrument or product, or to adopt any investment strategy as it is not provided based on an assessment of your investing knowledge and experience, your financial situation or your investment objectives. The value of your investments, and the income derived from them, may go down as well as up. You may not get back all the money that you invest. The investments referred to in this article may not be suitable for all investors, and if in doubt, an investor should seek advice from a qualified investment adviser.
Full performance can be found on the company or index summary page on the interactive investor website. Simply click on the company's or index name highlighted in the article.
Disclosure
We use a combination of fundamental and technical analysis in forming our view as to the valuation and prospects of an investment. Where relevant we have set out those particular matters we think are important in the above article, but further detail can be found here.
Please note that our article on this investment should not be considered to be a regular publication.
Details of all recommendations issued by ii during the previous 12-month period can be found here.
ii adheres to a strict code of conduct. Contributors may hold shares or have other interests in companies included in these portfolios, which could create a conflict of interests. Contributors intending to write about any financial instruments in which they have an interest are required to disclose such interest to ii and in the article itself. ii will at all times consider whether such interest impairs the objectivity of the recommendation.
In addition, individuals involved in the production of investment articles are subject to a personal account dealing restriction, which prevents them from placing a transaction in the specified instrument(s) for a period before and for five working days after such publication. This is to avoid personal interests conflicting with the interests of the recipients of those investment articles.
Editor's Picks