Chart of the week: A breakout opportunity for FTSE 100
29th January 2018 11:38
by John Burford from interactive investor
Share on
FTSE resumes uptrend
Sometimes, best efforts are not quite good enough - and that applies in spades in to field of technical analysis of price charts. At every second of the day, we are using the evidence presented to us in real time, and attempting to come up with a best guess for the most likely path the market could follow in the immediate future.
A good analyst looks upon his/her forecasts as an exercise in probabilities. Some outcomes are more likely than others. One of the great advantages of using the Elliott wave model is that very often, we are offered a choice of only two main options.
When set against the 'fingers crossed' trading method, that is a considerable bonus.
Not only that, but it can offer a definite price level where one option is proven to have failed. That gives you a place to set stop losses in a wholly scientific way. There are no ifs and buts about it. Again, this is a considerable advantage over most other methods.
Note, I am focusing on how to limit possible losses here, which is the backbone of all reliable systems. You must know how to limit losses on your losers to prevent a black hole from developing in your trading account. You may have a few winners in your account, but it only takes one un-disciplined un-protected losing trade to wipe out much of your account.
Last week, I had this as my best guess on the short term 4-hour chart
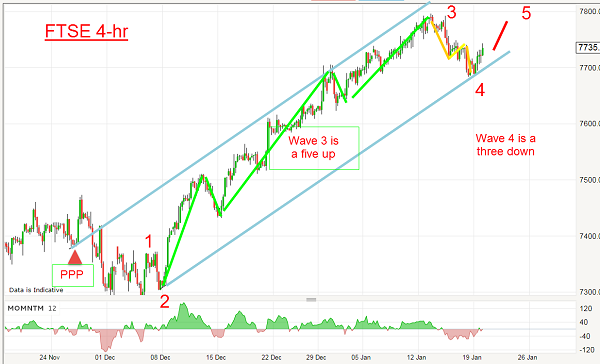
My tramline placements were my best guess and I was looking for a rally off the lower line in wave 5 off wave 4, which was a satisfactory three down (always corrective to the main trend). Odds were good the rally would continue - and to go long was the percentage play.
But it was not to be, and with sterling surging early last week, that put pressure on the perceived earnings of the international FTSE component companies. Many of these companies receive revenue in dollars, which was weakening.
Chart of the week: Predict what FTSE 100 will do next using these clues
Although my forecast was incorrect, I noted the level at which I would be wrong. This is what I wrote last week:
But a move down below the 7,680 level near-term would at least delay the above scenario. But today, odds favour my bullish scenario.
The 7,680 level was the clear stop-loss on any long trade - and that was hit on Wednesday for a small loss.
But with a new low in the 7,600 area, I then looked for a new pair of tramlines that would comply with my rules - and here they are:
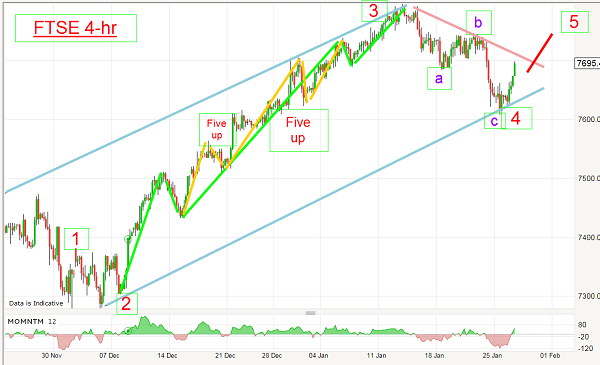
The upper one was a better fit on the various highs and a parallel tramline drawn through the wave 2 low took it perfectly to last week's low. That low was likely to hold, and new long trades could be placed with confidence.
Now, I had a larger three down off the wave 3 high for wave 4 and odds then favoured a resumption of the uptrend, which is now in progress as wave 5 up starts.
As I stated, the uptrend was delayed by one more leg down, but now the picture is even clearer than it was a week ago.
I am looking for a new high in wave 5. The key is to break above the minor pink trendline and a push above the b wave high at the 7,750 level. And if sterling comes off the boil this week, as seems likely, FTSE stocks would surely get a big boost.
Of course, a break down below the 7,600 level would put a severe spanner in the works. But so far, odds favour the bullish scenario.
ii publishes information and ideas which are of interest to investors. Any recommendation made in this article is based on the views of the writer, which do not take into account your circumstances. This is not a personal recommendation. If you are in any doubt as to the action you should take, please consult an authorised investment adviser. ii do not, under any circumstances, accept liability for losses suffered by readers as a result of their investment decisions.
The value of your investments, and the income derived from them, may go down as well as up. You may not get back all the money that you invest.
Disclosure
We use a combination of fundamental and technical analysis in forming our view as to the valuation and prospects of an investment. Where relevant we have set out those particular matters we think are important in the above article, but further detail can be found here.
Please note that our article on this investment should not be considered to be a regular publication.
Details of all recommendations issued by ii during the previous 12-month period can be found here.
ii adheres to a strict code of conduct. Members of ii staff may hold shares in companies included in these portfolios, which could create a conflict of interests. Any member of staff intending to write about any financial instruments in which they have an interest are required to disclose such interest to ii and in the article itself. We will at all times consider whether such interest impairs the objectivity of the recommendation.
In addition, staff involved in the production of investment articles are subject to a personal account dealing restriction, which prevents them from placing a transaction in the specified instrument(s) for a period before and for five working days after such publication. This is to avoid personal interests conflicting with the interests of the recipients of those investment articles.
These articles are provided for information purposes only. Occasionally, an opinion about whether to buy or sell a specific investment may be provided by third parties. The content is not intended to be a personal recommendation to buy or sell any financial instrument or product, or to adopt any investment strategy as it is not provided based on an assessment of your investing knowledge and experience, your financial situation or your investment objectives. The value of your investments, and the income derived from them, may go down as well as up. You may not get back all the money that you invest. The investments referred to in this article may not be suitable for all investors, and if in doubt, an investor should seek advice from a qualified investment adviser.
Full performance can be found on the company or index summary page on the interactive investor website. Simply click on the company's or index name highlighted in the article.
Disclosure
We use a combination of fundamental and technical analysis in forming our view as to the valuation and prospects of an investment. Where relevant we have set out those particular matters we think are important in the above article, but further detail can be found here.
Please note that our article on this investment should not be considered to be a regular publication.
Details of all recommendations issued by ii during the previous 12-month period can be found here.
ii adheres to a strict code of conduct. Contributors may hold shares or have other interests in companies included in these portfolios, which could create a conflict of interests. Contributors intending to write about any financial instruments in which they have an interest are required to disclose such interest to ii and in the article itself. ii will at all times consider whether such interest impairs the objectivity of the recommendation.
In addition, individuals involved in the production of investment articles are subject to a personal account dealing restriction, which prevents them from placing a transaction in the specified instrument(s) for a period before and for five working days after such publication. This is to avoid personal interests conflicting with the interests of the recipients of those investment articles.