Chart of the week: can Amazon’s results blow the doors off?
Our chartist asks – who is selling the tech giant’s stocks, and why?
25th January 2021 11:47
Our chartist asks – who is selling the tech giant’s stocks, and why?

In common with most US tech behemoths, Amazon (NASDAQ:AMZN) has recovered massively from the slump that I call the ‘corona crash’ in March last year.
In fact, the shares have advanced 120% off the March lows – an incredible feat for a monster $1 trillion (£730 billion) company. Of course, it is having an excellent pandemic, along with other FAANG (Facebook (NASDAQ:FB), Amazon, Apple (NASDAQ:AAPL), Netflix (NASDAQ:NFLX), and Alphabet (NASDAQ:GOOGL)) stocks. This is because global lockdowns are heaven-sent for efficient internet-based operations. It’s an ill wind…
But bullish sentiment towards stocks has reached epic proportions – there is nary a pundit I have read that is bearish. Most are wildly bullish as they look forward to economies getting ‘back to normal’ soon as the vaccines are rolled out at speed – and central banks shower anything in sight with largesse to tide them over. The pending $2 trillion of US stimulus (the ‘Biden bung’) is the most generous of the lot.
And that has sent the antennae of the small band of contrarians twitching.
With the US dollar in an assumed slump, is there any reason not to buy US equities? What could possibly go wrong?
So, just about everyone feels positive about Amazon. But one question the bulls need to answer is this: who is doing the selling and why? For every single trade, there is a buyer and a seller.
At the end of each trading day, there have been an equal number of buy trades and of sell trades. So who are these crazy sellers? Don’t they know the price is going up? Why don’t they just hang on, sell later and thus achieve a better price?
- Market snapshot: big test for the optimists this week
- Are you saving enough for retirement? Our calculator can help you find out
Of course, there are many reasons for selling an advancing share, but expecting the price to be higher tomorrow is not one of them. That means that every seller today is either bearish in the near term, or neutral. That pits them against the bullish buyers – and that is what creates the market.
One point – we have known about the bullish effects on Amazon of the pandemic lockdowns from at least March, yet from August the shares have gone nowhere. It is highly likely that the company has made even more money as the pandemic has rolled on, with more severe lockdowns introduced recently. So why have the shares not responded to the upside?
Obviously, something else is going on besides the cause-and-effect conclusions the fundamentalists infer.
Here is the very instructive daily chart of prices off the March corona crash low:
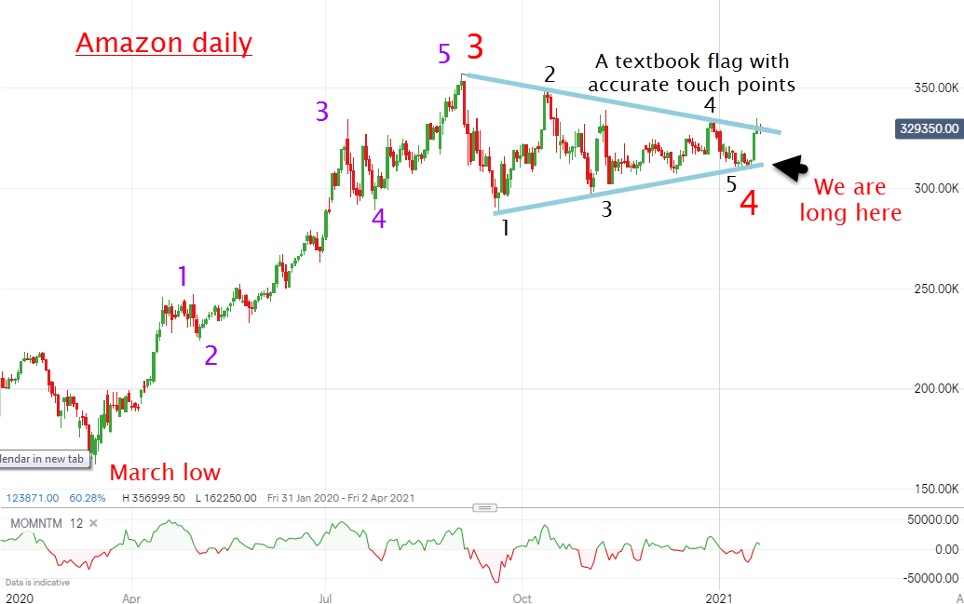
Source: interactive investor. Past performance is not a guide to future performance.
The rally off that low is impulsive (in five clear sub-waves and in the direction of the main trend). But it ran into a brick wall in August at the red wave three high at the $356 level. From there, it has been tracing out a textbook flag (or wedge), which has the classic five sub-waves. The lines of support and resistance converge and a breakout approaches out of this consolidation.
If my wave labels are correct, we should see a final thrust in red wave five. Earnings for Q4 2020 are due to be released on 2 February and are probably going to be strong. But has the share price discounted a great earnings figure already? Will we see another ‘buy the rumour, sell the news’ event?
Prudence suggests taking some profits on longs.
John Burford is the author of the definitive text on his trading method, Tramline Trading. He is also a freelance contributor and not a direct employee of interactive investor.
These articles are provided for information purposes only. Occasionally, an opinion about whether to buy or sell a specific investment may be provided by third parties. The content is not intended to be a personal recommendation to buy or sell any financial instrument or product, or to adopt any investment strategy as it is not provided based on an assessment of your investing knowledge and experience, your financial situation or your investment objectives. The value of your investments, and the income derived from them, may go down as well as up. You may not get back all the money that you invest. The investments referred to in this article may not be suitable for all investors, and if in doubt, an investor should seek advice from a qualified investment adviser.
Full performance can be found on the company or index summary page on the interactive investor website. Simply click on the company's or index name highlighted in the article.
Disclosure
We use a combination of fundamental and technical analysis in forming our view as to the valuation and prospects of an investment. Where relevant we have set out those particular matters we think are important in the above article, but further detail can be found here.
Please note that our article on this investment should not be considered to be a regular publication.
Details of all recommendations issued by ii during the previous 12-month period can be found here.
ii adheres to a strict code of conduct. Contributors may hold shares or have other interests in companies included in these portfolios, which could create a conflict of interests. Contributors intending to write about any financial instruments in which they have an interest are required to disclose such interest to ii and in the article itself. ii will at all times consider whether such interest impairs the objectivity of the recommendation.
In addition, individuals involved in the production of investment articles are subject to a personal account dealing restriction, which prevents them from placing a transaction in the specified instrument(s) for a period before and for five working days after such publication. This is to avoid personal interests conflicting with the interests of the recipients of those investment articles.
Editor's Picks