Chart of the week: a cheap pharmaceutical stock with potential
Our chartist goes off-piste with this share, which could be set for a sharp rally.
22nd March 2021 14:03
by John Burford from interactive investor
Share on
Our chartist goes off-piste with this share, which could be set for a sharp rally.

I am going slightly off-piste this week with a small US pharmaceutical share, founded in 2009, that I believe shows great promise. The company, Clovis Oncology (NASDAQ:CLVS), produces cancer treatments. I have been following it for some time for my clients.
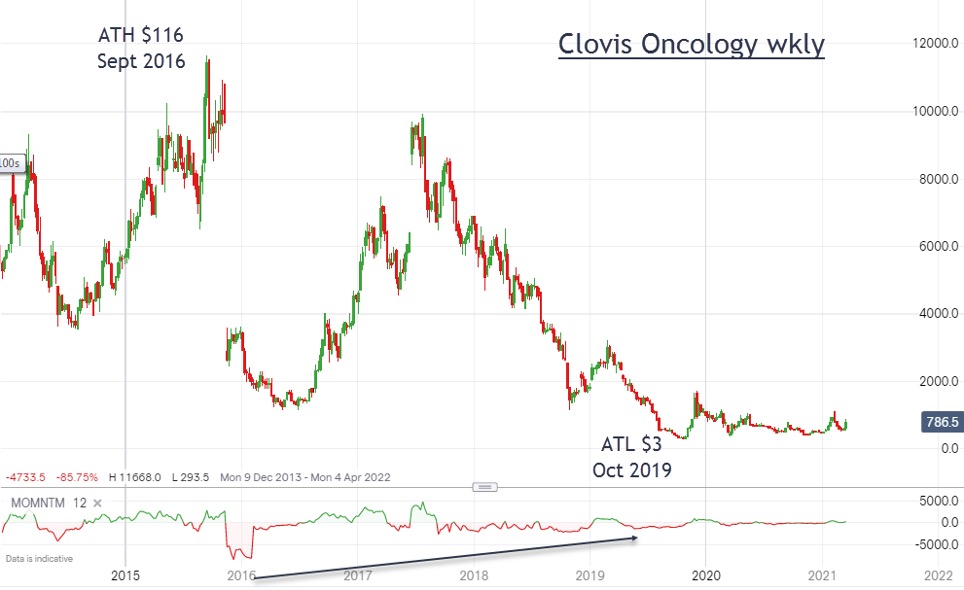
Below is the weekly chart from 2013, which shows how volatile shares of small ‘pharmas’ can be. Various drug trials are run – and are either failures (common) or blockbusters (rare). As with all early ventures, speculators are drawn in, and when initial results appear promising they bid up the shares to sometimes great heights.
But they can be excellent vehicles for my ‘buy low, sell high’ strategy – especially when you can catch them after substantial declines, as here. These are true roller-coaster rides!
Past performance is not a guide to future performance.
The all-time high (ATH) was put in at $116 (£83.64) in 2016 as results from one trial was heavily anticipated. But note the disappointment when news broke the trial had failed, in the shape of a huge gap down from $100 to $30 in a flash.
And, after a basing period, they roared northwards again as new drugs were trialled. The shares reached the $100 mark again, but once more great results failed to materialise and the shares drifted down to the all-time low (ATL) in October 2019 at the lowly $3 point.
It was back to the drawing board for the company scientists, but they must have learned a lot from the previous failures, so is this next venture the ‘third time lucky’ one?
Past performance is not a guide to future performance.
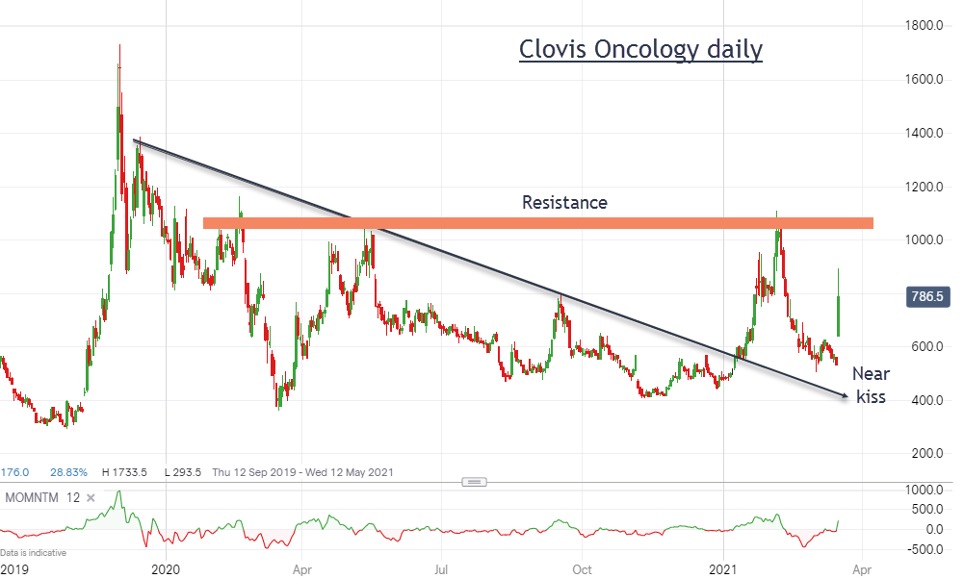
I have a super downtrend line which was broken in January pushing the shares up to my resistance zone around the $10 area. It then fell back to attempt a traditional ‘kiss’ and ‘scalded cat bounce’ on the line where I became interested in trading it again. Note the near miss on the kiss, which may be significant in supporting a sharp rally phase now.
On Friday, news came of positive developments in one of its treatments, and the shares shot up to more than $8 in what appears to be the start of another major leg-up.
Any push above my $10 resistance bar would likely send them up towards my next target of around $25, with higher potential. I remain bullish, with my fail-safe level at the $5 mark.
John Burford is the author of the definitive text on his trading method, Tramline Trading. He is also a freelance contributor and not a direct employee of interactive investor.
These articles are provided for information purposes only. Occasionally, an opinion about whether to buy or sell a specific investment may be provided by third parties. The content is not intended to be a personal recommendation to buy or sell any financial instrument or product, or to adopt any investment strategy as it is not provided based on an assessment of your investing knowledge and experience, your financial situation or your investment objectives. The value of your investments, and the income derived from them, may go down as well as up. You may not get back all the money that you invest. The investments referred to in this article may not be suitable for all investors, and if in doubt, an investor should seek advice from a qualified investment adviser.
Full performance can be found on the company or index summary page on the interactive investor website. Simply click on the company's or index name highlighted in the article.
Disclosure
We use a combination of fundamental and technical analysis in forming our view as to the valuation and prospects of an investment. Where relevant we have set out those particular matters we think are important in the above article, but further detail can be found here.
Please note that our article on this investment should not be considered to be a regular publication.
Details of all recommendations issued by ii during the previous 12-month period can be found here.
ii adheres to a strict code of conduct. Contributors may hold shares or have other interests in companies included in these portfolios, which could create a conflict of interests. Contributors intending to write about any financial instruments in which they have an interest are required to disclose such interest to ii and in the article itself. ii will at all times consider whether such interest impairs the objectivity of the recommendation.
In addition, individuals involved in the production of investment articles are subject to a personal account dealing restriction, which prevents them from placing a transaction in the specified instrument(s) for a period before and for five working days after such publication. This is to avoid personal interests conflicting with the interests of the recipients of those investment articles.