Chart of the week: do equinoxes really affect stock trends?
Savvy traders don’t discount evidence that shortening days cause market reversals, says our chartist.
21st September 2020 11:18
by John Burford from interactive investor
Share on
Evidence that shortening or lengthening days cause market reversals is not discounted by savvy traders, according to our chartist.

It has long been observed that at or around the time of one of the two annual equinoxes, stock trends often reverse course.
At the equinox, the length of the day equals that of the night (12 hours each!) and essentially, the summer days turn into autumn nights, and vice versa, twice a year.
Using that analogy, it seems bull trends can turn into bear trends, as traders can flip their perceptions at such times.
And many old-time traders have taken advantage of that established fact. Of course, trends do not always change at such times, but smart traders always keep an eye out for likely trend reversals around March 22 and September 22 in each year.
- Find out about: US Earnings Season | Top US Stocks | Interactive investor Offers
This is my chart of many of the equinox appearances since the year 2000 plotted against the S&P 500.
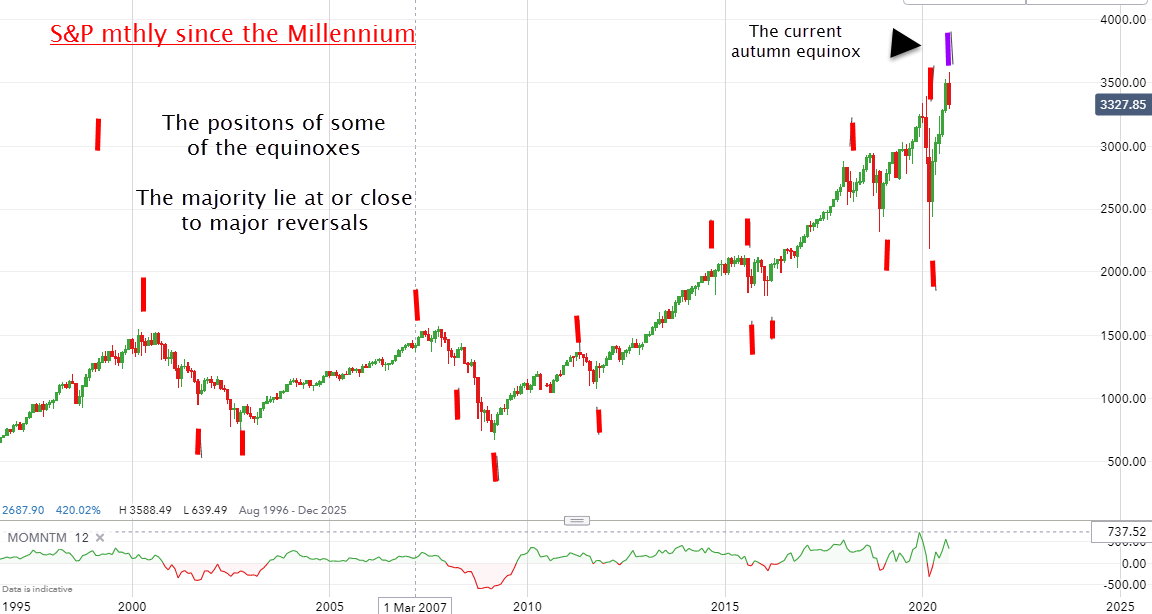
Source: interactive investor. Past performance is not a guide to future performance.
You will see 16 of the possible 40 settings of the equinox lie pretty accurately around a major trend reversal. The current Autumn E
equinox appears to coincide with a top. Very pretty.
And just as pretty was the Spring equinox on March 22 which coincided precisely with the huge corona crash low! Now that’s what I call a reversal, as markets have been in strong bull mode ever since – until very recently, of course.
- FTSE 100 struggles to keep up with global stock markets
- Why reading charts can help you become a better investor
- Don’t hang up on this share
Here is the latest action showing the three latest equinoxes:
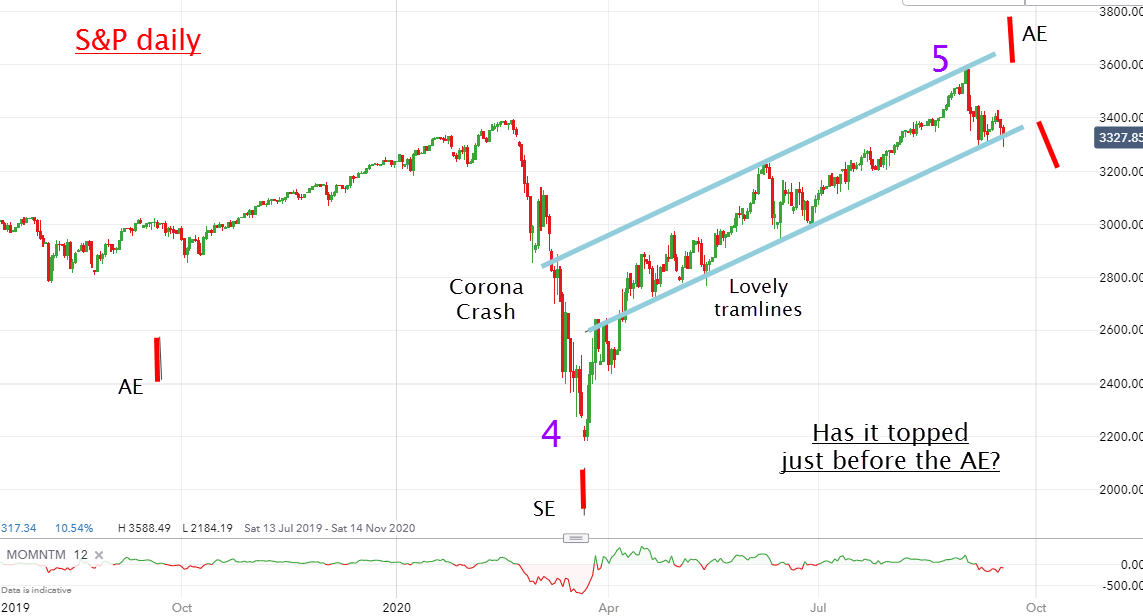
Source: interactive investor. Past performance is not a guide to future performance.
The wave five all-time high was made on 2 September as it touched and moved sharply down off the upper tramline and currently, the market is testing the lower one.
- Have you got an exit strategy as US tech shares tumble?
- Take control of your retirement planning with our award-winning, low-cost Self-Invested Personal Pension (SIPP)
A hard break down here would massively increase the odds that the 2 September high marked the high of the entire bull market in stocks going back a very long time.
So could the path of the earth around the sun tell us anything meaningful about the direction of shares? If history is any guide (and it should be), investors/traders would be wise not to dismiss this seemingly left-field proposition.
Monday flash: Shares are massively down across the board this morning – right on cue?
For more information about Tramline Traders, or to take a three-week free trial, go to www.tramlinetraders.com.
John Burford is the author of the definitive text on his trading method, Tramline Trading. He is also a freelance contributor and not a direct employee of interactive investor.
These articles are provided for information purposes only. Occasionally, an opinion about whether to buy or sell a specific investment may be provided by third parties. The content is not intended to be a personal recommendation to buy or sell any financial instrument or product, or to adopt any investment strategy as it is not provided based on an assessment of your investing knowledge and experience, your financial situation or your investment objectives. The value of your investments, and the income derived from them, may go down as well as up. You may not get back all the money that you invest. The investments referred to in this article may not be suitable for all investors, and if in doubt, an investor should seek advice from a qualified investment adviser.
Full performance can be found on the company or index summary page on the interactive investor website. Simply click on the company's or index name highlighted in the article.
Disclosure
We use a combination of fundamental and technical analysis in forming our view as to the valuation and prospects of an investment. Where relevant we have set out those particular matters we think are important in the above article, but further detail can be found here.
Please note that our article on this investment should not be considered to be a regular publication.
Details of all recommendations issued by ii during the previous 12-month period can be found here.
ii adheres to a strict code of conduct. Contributors may hold shares or have other interests in companies included in these portfolios, which could create a conflict of interests. Contributors intending to write about any financial instruments in which they have an interest are required to disclose such interest to ii and in the article itself. ii will at all times consider whether such interest impairs the objectivity of the recommendation.
In addition, individuals involved in the production of investment articles are subject to a personal account dealing restriction, which prevents them from placing a transaction in the specified instrument(s) for a period before and for five working days after such publication. This is to avoid personal interests conflicting with the interests of the recipients of those investment articles.