Chart of the week: A FTSE 100 dog back in favour
14th May 2018 12:23
What's next for Next?
I started getting interested in these shares late last year when they were in plunge mode off a high of £82 to the July 2017 low of £36. Of course, that is contrary to most people's trading approach who only get interested when the trend is firmly up (egged on by extensive media coverage). That runs the risk of buying near a top and suffering the agony of wondering if it would ever recover.
That is not a great emotional (or financial) situation to be in. The default position then is to simply tuck the investment into the back of the drawer and focus on other trades. Naturally, when you come to check the market days/weeks/months later, it has lost even more! That is when you decide to get rid of that loser - just as it takes off again without you. It's a cruel world - unless you have a reliable system.
Personally, I do not want to be in that place and, therefore, need to see a trade working pretty much straight away in my direction. That is why I developed my Tramline Trading approach.
The UK retail sector has been hammered - and was one of the victims - by the Effect. And none more so than the clothing retailers. and shares are on the floor, but Next seemed to be different - they were building a substantial online presence and held out the potential to escape the fate of those two bricks and mortar giants.
Here is the chart I pulled on 23 November:
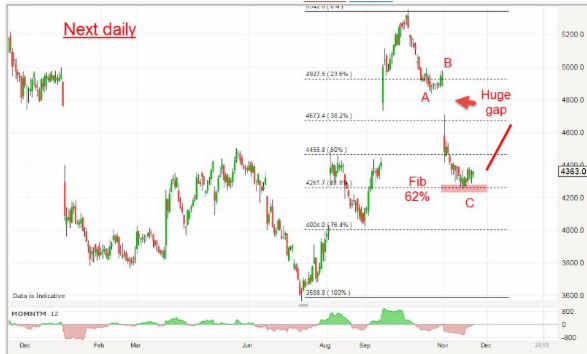
Source: interactive investor Past performance is not a guide to future performance
From the £36 low, the shares staged a sharp rally with gaps to the October high. That was the first sign of a possible turnaround. The correction occurred in a three wave A-B-C pattern right to the normal Fibonacci 62% support to make one of my favourite setups for a trade. I was able to buy at the £44 area using a close stop just below the Fib level.
Despite the ongoing bearish news coming out of retail, the shares have not collapsed (as have many others) but have made a textbook wedge pattern, which is usually a period of consolidation:
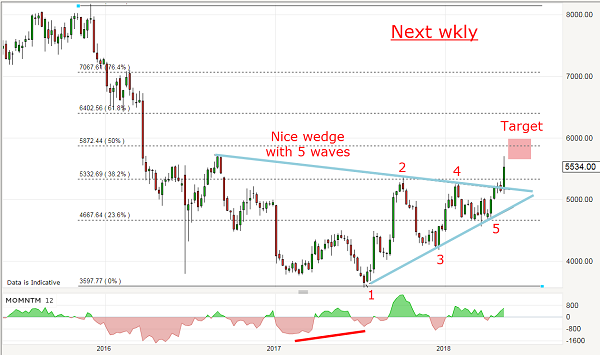
Source: interactive investor Past performance is not a guide to future performance
It turns out my entry was near the wave 3 low and my stop was never in any danger of being hit. That is my preferred option! Last week, the shares blew up out of the wedge and are heading for my main target at the meeting of the Fibonacci 50% retrace and the start of the wedge (a common recovery level).
Prudence tells me to take at least some profit as a major target is within range. That is a cool gain of £12 (28%). But is there more upside?
I have to note the weakening momentum into the current rally as a warning sign. But, so far, the immediate trend remains up, and there should be more fuel in the tank to perhaps push it up to the Fib 62% retrace around the £64 area.
John Burford is the author of the definitive text on his trading method, Tramline Trading.
These articles are provided for information purposes only. Occasionally, an opinion about whether to buy or sell a specific investment may be provided by third parties. The content is not intended to be a personal recommendation to buy or sell any financial instrument or product, or to adopt any investment strategy as it is not provided based on an assessment of your investing knowledge and experience, your financial situation or your investment objectives. The value of your investments, and the income derived from them, may go down as well as up. You may not get back all the money that you invest. The investments referred to in this article may not be suitable for all investors, and if in doubt, an investor should seek advice from a qualified investment adviser.
Full performance can be found on the company or index summary page on the interactive investor website. Simply click on the company's or index name highlighted in the article.
Disclosure
We use a combination of fundamental and technical analysis in forming our view as to the valuation and prospects of an investment. Where relevant we have set out those particular matters we think are important in the above article, but further detail can be found here.
Please note that our article on this investment should not be considered to be a regular publication.
Details of all recommendations issued by ii during the previous 12-month period can be found here.
ii adheres to a strict code of conduct. Contributors may hold shares or have other interests in companies included in these portfolios, which could create a conflict of interests. Contributors intending to write about any financial instruments in which they have an interest are required to disclose such interest to ii and in the article itself. ii will at all times consider whether such interest impairs the objectivity of the recommendation.
In addition, individuals involved in the production of investment articles are subject to a personal account dealing restriction, which prevents them from placing a transaction in the specified instrument(s) for a period before and for five working days after such publication. This is to avoid personal interests conflicting with the interests of the recipients of those investment articles.
Editor's Picks