Chart of the week: A FTSE 100 tech play
An incredible price recovery has caught the eye of our technical analyst, who describes his next trade.
8th April 2019 10:58
by John Burford from interactive investor
Share on
An incredible price recovery has caught the eye of our technical analyst, who describes his next trade.

Taking a hard look at Micro Focus
Micro Focus (LSE:MCRO) is a former tech darling that peaked in November 2017 at the incredible £27 top after a meteoric climb from the 50p area. Its story was compelling as it acquired a raft of other software outfits to become a UK tech biggie.
But as with all rockets that run out of fuel, it came back down to earth with a bang in March 2018 following a poor trading update and the departure of its chief executive. That created a huge gap and the shares about halved overnight. They have been trying to regain their lofty heights for the past year – and the 'gap' has now been closed. So, are they a buy again, as so many pundits proclaim?
Here is the weekly chart showing the Elliott Wave pattern to the top:
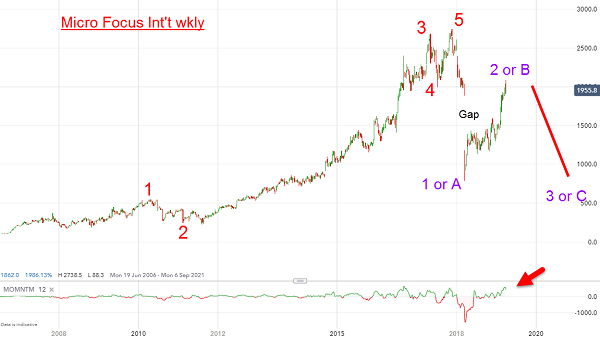
Source: interactive investor Past performance is not a guide to future performance
I have a clear five waves to the top with a very long and strong third wave. The descent off the fifth wave high was very sharp and the gap is enormous. After that panic selling, the bottom was found in the £8 area for a decline of £19 off the £27 high (70%). Ouch!
But just as the bullish enthusiasm was overdone at the top, so was the panic selling at the bottom. And a terrific opportunity to pick up some low-priced tech shares just as the tech sector was hotting up again.
So now the shares have recovered to the £20 area, are they still a buy? At least one analyst has a £30 target, but in my opinion - no. And here is why:
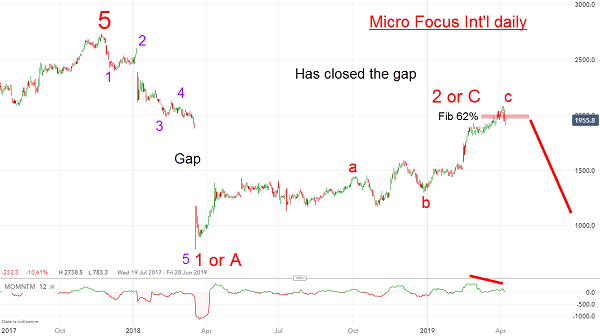
Source: interactive investor Past performance is not a guide to future performance
The decline off the high is in a clear five waves that are impulsive, given the huge one-way gap a year ago. And the relief rally has stuttered on its climb and takes the clear shape of three waves – a clear sign it is counter-trend.
And the latest surge in the C wave has carried to the Fibonacci 62% retrace while closing the yawning gap (remember, gaps act as magnets). Once gaps are closed, markets tend to reverse – at least at first. In addition, there is a momentum divergence at last week’s high, which is a sign buying pressure is lifting.
So, all evidence points to the rally running out of steam here or nearby. Odds very much favour a resumption of the decline. With the shares trading at around the £21 area, a reasonable first target is the B wave low at £12 with lower potential thereafter.
For more information about Tramline Traders, or to take a three-week free trial, go to www.tramlinetraders.com.
John Burford is the author of the definitive text on his trading method, Tramline Trading. He is also a freelance contributor and not a direct employee of interactive investor.
These articles are provided for information purposes only. Occasionally, an opinion about whether to buy or sell a specific investment may be provided by third parties. The content is not intended to be a personal recommendation to buy or sell any financial instrument or product, or to adopt any investment strategy as it is not provided based on an assessment of your investing knowledge and experience, your financial situation or your investment objectives. The value of your investments, and the income derived from them, may go down as well as up. You may not get back all the money that you invest. The investments referred to in this article may not be suitable for all investors, and if in doubt, an investor should seek advice from a qualified investment adviser.
Full performance can be found on the company or index summary page on the interactive investor website. Simply click on the company's or index name highlighted in the article.
Disclosure
We use a combination of fundamental and technical analysis in forming our view as to the valuation and prospects of an investment. Where relevant we have set out those particular matters we think are important in the above article, but further detail can be found here.
Please note that our article on this investment should not be considered to be a regular publication.
Details of all recommendations issued by ii during the previous 12-month period can be found here.
ii adheres to a strict code of conduct. Contributors may hold shares or have other interests in companies included in these portfolios, which could create a conflict of interests. Contributors intending to write about any financial instruments in which they have an interest are required to disclose such interest to ii and in the article itself. ii will at all times consider whether such interest impairs the objectivity of the recommendation.
In addition, individuals involved in the production of investment articles are subject to a personal account dealing restriction, which prevents them from placing a transaction in the specified instrument(s) for a period before and for five working days after such publication. This is to avoid personal interests conflicting with the interests of the recipients of those investment articles.