Chart of the week: Fuel for further gains here
Now that this November tip has come good, our chartist sets a new price target.
20th January 2020 13:20
by John Burford from interactive investor
Now that this November tip has come good, our chartist sets a new price target.

Canopy Growth follows my roadmap from November
I last covered Canopy Growth (TSE:WEED) in my COTW of 11th November 2019, where I laid out my distinctly bullish case. Then, these US and Canadian marijuana companies were experiencing typically difficult phases where the initial over-the-top enthusiasm for this freshly legalised sector hit reality. There were supply problems and the bears pounced.
Perhaps the fund managers who initially jumped in with both feet were influenced by their student recollections of having indulged (but not inhaled, of course).
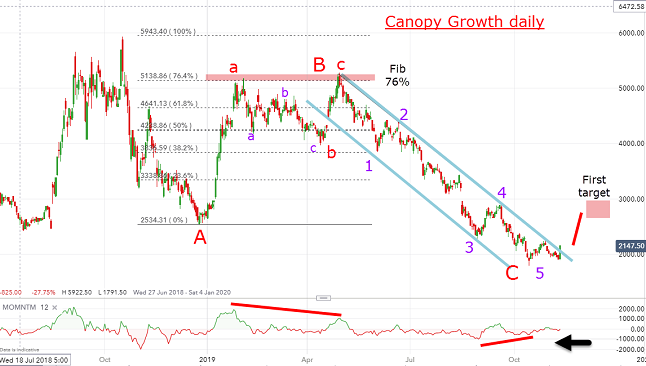
In any case, the shares were being massacred – but I spotted a low risk/high probability opportunity. This was the chart I posted in November:
Source: interactive investor Past performance is not a guide to future performance
I had counted a full five waves down set between my lovely blue tramlines, that presented a textbook setup when combined with the large momentum divergence at my wave 5 of C low. Odds were looking good that the market would jump up above the upper tramline, which would then become a line of support. This is the current picture:
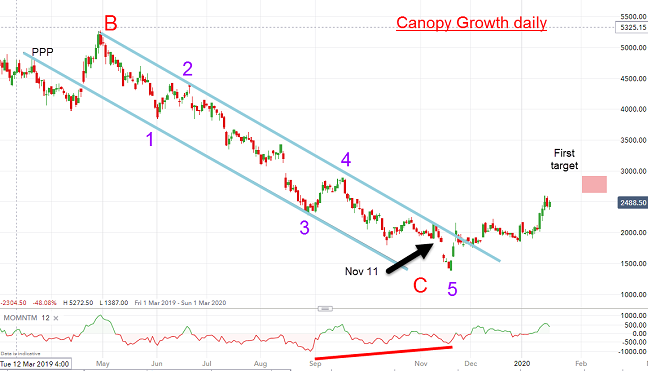
Source: interactive investor Past performance is not a guide to future performance
There was one more dip to the 20 November low at $14! But did that spoil my bullish outlook? At that low, the momentum divergence was still intact and the wave 5 of C low was likely in that new spot. I had no need to abandon my stance – provided the upper tramline could be swiftly penetrated.
A few days later, the new uptrend was confirmed and I had my major low in place, despite the recent negative company news.
This what I wrote in November:
“And the Drake news on Friday helped push the market above my upper tramline in what should be the start of a bull phase with my first target around the $20 region with higher potential thereafter. With short interest still very high, I believe odds strongly favour further advances.”
My first $20 target has been achieved and now it is advancing towards my next target at the $29-$30 region. The high short interest should provide the fuel.
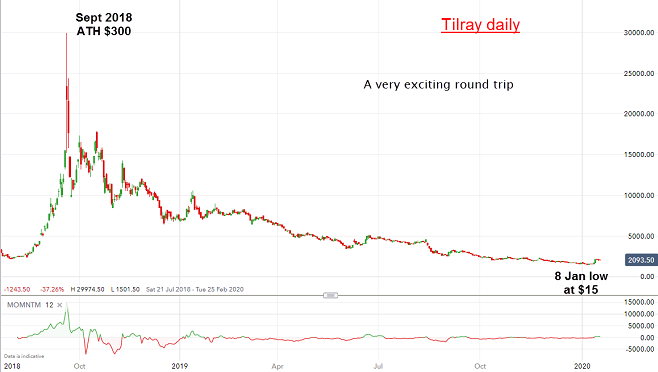
And for comparison, here is another large-cap ‘pot stock’, Tilray (NASDAQ:TLRY):
Source: interactive investor Past performance is not a guide to future performance
From the manic $300 high in September 2018 to the very recent $15 low – a loss of 95% and a very painful experience – imagine if you had put the shares away in the back of your drawer and only now checked the price with your broker. Ouch!!
But with both, we have a classic Buy Low/Sell High setup.
For more information about Tramline Traders, or to take a three-week free trial, go to www.tramlinetraders.com.
John Burford is the author of the definitive text on his trading method, Tramline Trading. He is also a freelance contributor and not a direct employee of interactive investor.
These articles are provided for information purposes only. Occasionally, an opinion about whether to buy or sell a specific investment may be provided by third parties. The content is not intended to be a personal recommendation to buy or sell any financial instrument or product, or to adopt any investment strategy as it is not provided based on an assessment of your investing knowledge and experience, your financial situation or your investment objectives. The value of your investments, and the income derived from them, may go down as well as up. You may not get back all the money that you invest. The investments referred to in this article may not be suitable for all investors, and if in doubt, an investor should seek advice from a qualified investment adviser.
Full performance can be found on the company or index summary page on the interactive investor website. Simply click on the company's or index name highlighted in the article.
Disclosure
We use a combination of fundamental and technical analysis in forming our view as to the valuation and prospects of an investment. Where relevant we have set out those particular matters we think are important in the above article, but further detail can be found here.
Please note that our article on this investment should not be considered to be a regular publication.
Details of all recommendations issued by ii during the previous 12-month period can be found here.
ii adheres to a strict code of conduct. Contributors may hold shares or have other interests in companies included in these portfolios, which could create a conflict of interests. Contributors intending to write about any financial instruments in which they have an interest are required to disclose such interest to ii and in the article itself. ii will at all times consider whether such interest impairs the objectivity of the recommendation.
In addition, individuals involved in the production of investment articles are subject to a personal account dealing restriction, which prevents them from placing a transaction in the specified instrument(s) for a period before and for five working days after such publication. This is to avoid personal interests conflicting with the interests of the recipients of those investment articles.