Chart of the week: Here's when to buy Vodafone shares
30th July 2018 11:24
by John Burford from interactive investor
Share on
All the waves are in place for a major reversal of the down trend, argues technical analyst John Burford who tells us when the charts says 'buy' Vodafone.

The mayhem last week in the Tech Titans (with Facebook Inc A crashing by 20% in two hours) has highlighted the growing disparity between the massively-overloved 'growth' and 'momentum' shares (mainly tech) and the much-neglected 'value' shares in old (and boring) reliable sectors such as telecoms.
My reading is that this violent action is a wake-up call to fund managers that the game has now changed and they had better rotate from chasing 'momentum' and put funds into relatively solid shares that pay attractive dividends. If shares are heading for at least a major correction, there will be a great advantage in receiving high dividends in the future, especially with interest rates still low (but rising).
And that brings me to one of the most attractive value shares in the FTSE 100 – Vodafone Group, which currently sports a very juicy dividend yield of 7%.
The timely article by Graeme Evans last Thursday (below) on the company laid out his bullish case based on the 'fundamentals' for the shares to start moving higher.
• Rationale for Vodafone 'buy' tip
• Vodafone's 7.5% yield is 'too cheap'
And they seem to be doing just that in the past couple of days. But what a negative performance they have displayed since hitting a high in January of £2.40 to Wednesday’s low at £1.73.
So today, I will offer my technical analysis of the chart and see if it matches up.
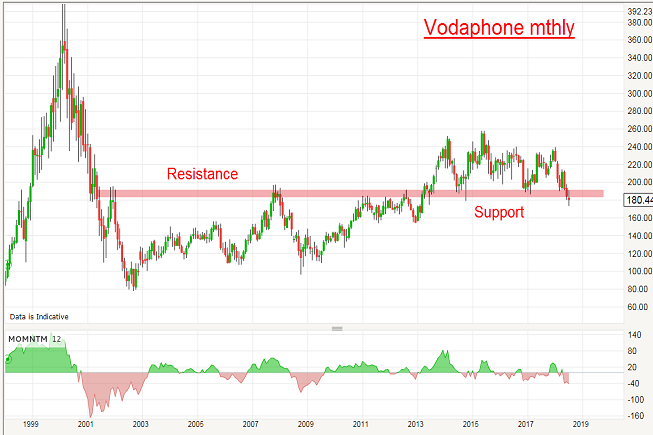
This is the very long term chart stretching back to 1999.
Source: interactive investor Past performance is not a guide to future performance
It's obvious that the shares are hardly in the same league as bitcoin for volatility! In the last five years, they have traded in the narrow range from high at £2.60 to a low of £1.80. And last week it was testing the lower reaches of that zone, which in fact is a very long term support area going back to 2000 (pink bar).
So at least at the £1.80 area, the shares have fallen into very solid long-term support and is very much a candidate for the Buy Low/Sell Higher approach.
To me, the above chart gives most of the information I need to make a decision. But there is more - and it shows up on the daily chart of the latest price action.
Source: interactive investor Past performance is not a guide to future performance
It's obvious that the shares are hardly in the same league as bitcoin for volatility! In the last five years, they have traded in the narrow range from high at £2.60 to a low of £1.80. And last week it was testing the lower reaches of that zone, which in fact is a very long term support area going back to 2000 (pink bar).
So at least at the £1.80 area, the shares have fallen into very solid long-term support and is very much a candidate for the Buy Low/Sell Higher approach.
To me, the above chart gives most of the information I need to make a decision. But there is more – and it shows up on the daily chart of the latest price action
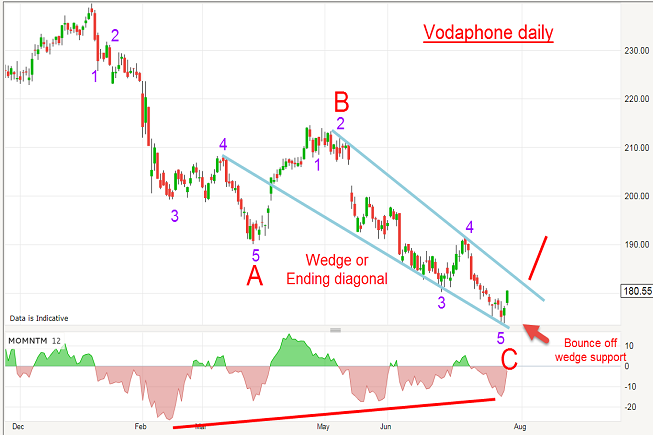
This shows the last bear move off the major high in January and is in three major waves A-B-C (this is a corrective pattern). And the sub-waves here are textbook with waves A and C containing the tell-tale impulsive five wave patterns. At last week’s £1.73 low – which bounced off the lower wedge line on a strong momentum divergence – all the waves are in place for a major reversal.
Confirmation would appear when the upper wedge line is broken especially on good volume (around £1.80) and then I can set my first target at the latest wave 4 high around £1.90. Beyond that, there is a very tempting yawning gap just above £2 and that is my second major target.
And after that, all would depend on the wave action off the low – and that I will be monitoring carefully. Naturally, a move below the £1.60 area would perhaps delay any rally potential, but I consider that at lower odds than otherwise.
John Burford is the author of the definitive text on his trading method, Tramline Trading. He is also a freelance contributor and not a direct employee of interactive investor.
These articles are provided for information purposes only. Occasionally, an opinion about whether to buy or sell a specific investment may be provided by third parties. The content is not intended to be a personal recommendation to buy or sell any financial instrument or product, or to adopt any investment strategy as it is not provided based on an assessment of your investing knowledge and experience, your financial situation or your investment objectives. The value of your investments, and the income derived from them, may go down as well as up. You may not get back all the money that you invest. The investments referred to in this article may not be suitable for all investors, and if in doubt, an investor should seek advice from a qualified investment adviser.
Full performance can be found on the company or index summary page on the interactive investor website. Simply click on the company's or index name highlighted in the article.
Disclosure
We use a combination of fundamental and technical analysis in forming our view as to the valuation and prospects of an investment. Where relevant we have set out those particular matters we think are important in the above article, but further detail can be found here.
Please note that our article on this investment should not be considered to be a regular publication.
Details of all recommendations issued by ii during the previous 12-month period can be found here.
ii adheres to a strict code of conduct. Contributors may hold shares or have other interests in companies included in these portfolios, which could create a conflict of interests. Contributors intending to write about any financial instruments in which they have an interest are required to disclose such interest to ii and in the article itself. ii will at all times consider whether such interest impairs the objectivity of the recommendation.
In addition, individuals involved in the production of investment articles are subject to a personal account dealing restriction, which prevents them from placing a transaction in the specified instrument(s) for a period before and for five working days after such publication. This is to avoid personal interests conflicting with the interests of the recipients of those investment articles.