Chart of the week: How Centrica could shock us all
Despite its problems, Centrica could enjoy a near-perfect alignment of bullish factors later this year.
8th July 2019 11:43
by John Burford from interactive investor
Share on
At a 20-year low, and despite a long list of problems, Centrica shares could experience a near-perfect alignment of bullish factors later this year, believes chartist John Burford.

Will Centrica now step on the gas?
Could it get any worse for British Gas owner Centrica (LSE:CNA)? The furore over the awarding to the CEO of a 44% pay rise to £2.4 million as the shares have now sunk to a 20-year low shows little sign of abating. Could this be the high-water mark in this era of rewards for failure?
This year alone, Centrica's share price has dropped from 140p to the current 88p, a loss of 38%. It seems a far cry from the 400p valuation six years ago.
But hold on! The massive 12p dividend remains, despite pressure for cuts, so for many investors the CEO is being seen as a hero - so far. Half-year results are due on 30 July which will be closely watched for signs of a dividend cut – and a likely change in direction for the company. That could be a very interesting scenario.
Not only has British Gas lost many customers to alternative suppliers, but market sentiment remains firmly bearish as many pundits see no hope at all for the shares to recover. Most say they wouldn’t touch it with a bargepole.
And that means only one thing – I am very interested in looking at the case for a contrarian stance (with great timing, of course)!
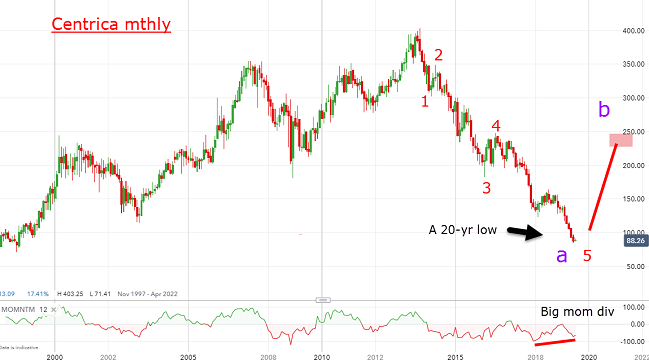
So, let's get to the all-knowing charts. Here is the very long-term monthly:
Source: interactive investor Past performance is not a guide to future performance
In the era before the energy markets were deregulated, Centrica was in a general bull market. Even the 2008/2009 Credit Crunch impacted the shares much less than many other FTSE 100 companies. And Centrica's share price high was set near the 400p mark in September 2013. Since then, it has been a ski run slide down the mountain.
And to create a new 20-year low takes some skill just as the FTSE 100 is knocking on all-time highs – and the Dow Jones/S&P 500/Nasdaq have this week made record highs!
But note the five-wave pattern on Centrica's chart, with the current market in an extended fifth wave. Elliott wave theory tells us that when the fifth wave of an impulse pattern such as this one terminates, a reversal begins. The question is: are we at or near the end of that fifth wave and, hence, at the start of a reversal?
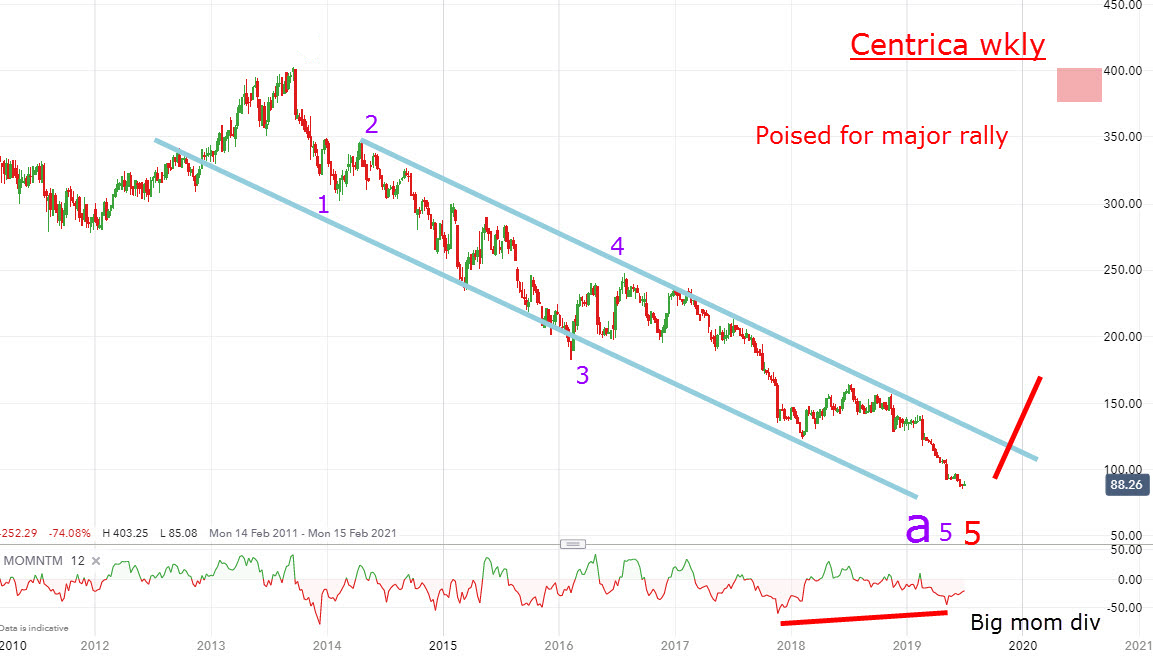
For clues, here is the weekly chart action off the high:
Source: interactive investor Past performance is not a guide to future performance
The red fifth wave also sports a five-wave pattern – and along very decent tramlines. That places the current market right at or near the termination of fifth waves of two degrees of scale – and on a momentum divergence on this chart as well.
That makes further downside as limited, and if the market can base around here and then push up through the upper tramline at 120p, I will be looking at a target at the 250p region. That should be the extent of my 'b' wave (see monthly chart) – and lead to a renewed slide.
And if the dividend is cut later this month to say 8p, even at the 120p target the yield will be a juicy 6.6% - not at all bad in today's low rate environment. That should boost demand for this very high value defensive share.
Finally, global natural gas prices are depressed, which should help increase margins this winter – if the trading desk is awake to the opportunity. We could be looking at a near-perfect alignment of bullish factors later this year, especially if the many shorts start to cover.
For more information about Tramline Traders, or to take a three-week free trial, go to www.tramlinetraders.com.
John Burford is the author of the definitive text on his trading method, Tramline Trading. He is also a freelance contributor and not a direct employee of interactive investor.
These articles are provided for information purposes only. Occasionally, an opinion about whether to buy or sell a specific investment may be provided by third parties. The content is not intended to be a personal recommendation to buy or sell any financial instrument or product, or to adopt any investment strategy as it is not provided based on an assessment of your investing knowledge and experience, your financial situation or your investment objectives. The value of your investments, and the income derived from them, may go down as well as up. You may not get back all the money that you invest. The investments referred to in this article may not be suitable for all investors, and if in doubt, an investor should seek advice from a qualified investment adviser.
Full performance can be found on the company or index summary page on the interactive investor website. Simply click on the company's or index name highlighted in the article.
Disclosure
We use a combination of fundamental and technical analysis in forming our view as to the valuation and prospects of an investment. Where relevant we have set out those particular matters we think are important in the above article, but further detail can be found here.
Please note that our article on this investment should not be considered to be a regular publication.
Details of all recommendations issued by ii during the previous 12-month period can be found here.
ii adheres to a strict code of conduct. Contributors may hold shares or have other interests in companies included in these portfolios, which could create a conflict of interests. Contributors intending to write about any financial instruments in which they have an interest are required to disclose such interest to ii and in the article itself. ii will at all times consider whether such interest impairs the objectivity of the recommendation.
In addition, individuals involved in the production of investment articles are subject to a personal account dealing restriction, which prevents them from placing a transaction in the specified instrument(s) for a period before and for five working days after such publication. This is to avoid personal interests conflicting with the interests of the recipients of those investment articles.