Chart of the week: How to trade Barclays ahead of results day
19th February 2018 12:47
by John Burford from interactive investor
Share on
Will the other Barclays shoe drop?
Exciting, isn't it? It appears the deep complacency investors were basking in for many months was shattered with a bang late last month. The VIX Fear measure of the US S&P 500 index made such a rapid ascent off the floor that it rivalled that of bitcoin and Elon Musk's rocket to Mars!
A derivative of VIX had been (mis?)-sold to US retail investors as a can't lose proposition and, in the space of one hour, most had lost their entire investment. Such are the ways of the market when dealing with sure things.
And now stock indexes are in rally mode off the deeply oversold lows made earlier in the month, and the VIX has returned back to earth.
And we are all asking is this a dip to buy or one to unload from?
Interestingly, the degree of the recoveries in the major global indexes are by no means equal.
The Nasdaq has recovered the most with a Fibonacci 76% retrace. The Dow, S&P and small cap Russell 2000 have regained a Fibonacci 62%, while the Japan Nikkei and German DAX are matching the with a gain of around the Fibonacci 38%. The is by far the weakest with only a recovery of just over 23%. A very wide variation.
Of course, many of these big differences are down to currency exchange rates, with the US dollar being exceptionally weak in recent months, particularly against sterling, the euro and the yen.
But with the rally in progress, should we be looking not to buy the dip - as most suggest - but to sell certain stocks either short or at least lighten up on longs?
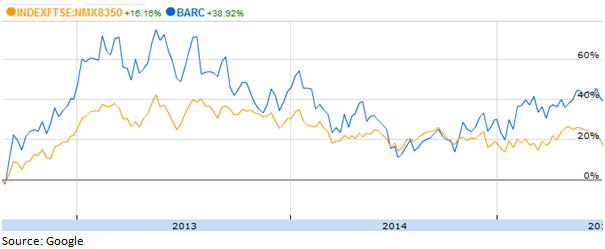
I am finding - a long-time favourite share - is in an appealing position.
Here is the daily chart with my wave labels:
The entire bear downtrend off the February 2017 high at 244p is a lovely five-wave affair to the 178p November low. The subsequent relief rally has the form of a three up, which is counter trend, with the c wave turning right on the Fibonacci 50% resistance, which is a normal retrace. Note the ominous momentum divergence between the a and c wave highs. This flagged the weaker rally in the c wave and heralded the sharp decline to the 187p low.
And last week, the market has recovered to the Fibonacci 50% retrace of the previous wave down at 200p and is close to kissing the minor pink trendline.
Odds are good that the market will turn back down from here or slightly higher. But if the market catches a bid on the annual results due on Thursday February 22nd, a rally extension to the 205p area is possible. But then, watch out.
ii publishes information and ideas which are of interest to investors. Any recommendation made in this article is based on the views of the writer, which do not take into account your circumstances. This is not a personal recommendation. If you are in any doubt as to the action you should take, please consult an authorised investment adviser. ii do not, under any circumstances, accept liability for losses suffered by readers as a result of their investment decisions.
The value of your investments, and the income derived from them, may go down as well as up. You may not get back all the money that you invest.
These articles are provided for information purposes only. Occasionally, an opinion about whether to buy or sell a specific investment may be provided by third parties. The content is not intended to be a personal recommendation to buy or sell any financial instrument or product, or to adopt any investment strategy as it is not provided based on an assessment of your investing knowledge and experience, your financial situation or your investment objectives. The value of your investments, and the income derived from them, may go down as well as up. You may not get back all the money that you invest. The investments referred to in this article may not be suitable for all investors, and if in doubt, an investor should seek advice from a qualified investment adviser.
Full performance can be found on the company or index summary page on the interactive investor website. Simply click on the company's or index name highlighted in the article.
Disclosure
We use a combination of fundamental and technical analysis in forming our view as to the valuation and prospects of an investment. Where relevant we have set out those particular matters we think are important in the above article, but further detail can be found here.
Please note that our article on this investment should not be considered to be a regular publication.
Details of all recommendations issued by ii during the previous 12-month period can be found here.
ii adheres to a strict code of conduct. Contributors may hold shares or have other interests in companies included in these portfolios, which could create a conflict of interests. Contributors intending to write about any financial instruments in which they have an interest are required to disclose such interest to ii and in the article itself. ii will at all times consider whether such interest impairs the objectivity of the recommendation.
In addition, individuals involved in the production of investment articles are subject to a personal account dealing restriction, which prevents them from placing a transaction in the specified instrument(s) for a period before and for five working days after such publication. This is to avoid personal interests conflicting with the interests of the recipients of those investment articles.