Chart of the week: An ideal set-up for this trade
9th July 2018 11:15
by John Burford from interactive investor
Share on
Already backed by our companies analyst, now technical analyst John Burford has found a great reason to like this stock which looks primed to bounce.

Is Petrofac in redemption?
The timely article by interactive investor analyst Edmond Jackson on 6 July on this share piqued my chartist interest.
I did cover it for COTW many moons ago – in April 2016, in fact – I asked, "Is Petrofac on the launchpad ready for take-off?"The shares were trading then at around the £8.50 area.
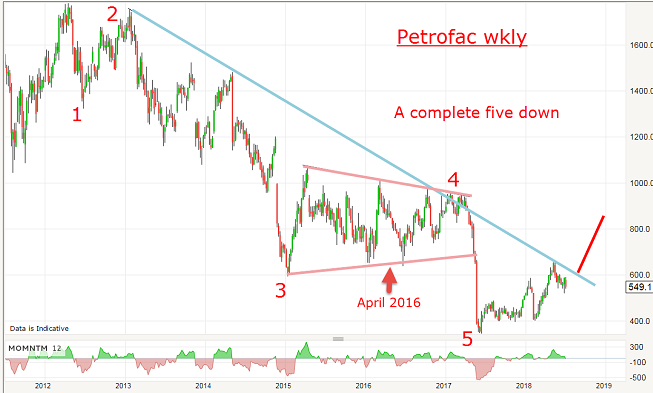
In fact, the lift-off turned out to be a damp squib as it resumed the bear trend shortly afterwards.Here is the weekly chart:
Source: interactive investor Past performance is not a guide to future performance
Unsuspected to me at the time, the market was tracing out a multi-year wedge pattern that is typical of fourth waves and, when the market broke hard below the lower wedge line in May last year, I knew we were likely in the final fifth wave and to prepare for it to bottom out.
I was originally influenced, I confess, by my correct prediction for a rally phase in crude in early 2016.Naturally, with a rising crude price (off the very low levels prevailing at the time), I assumed the oil service sector would participate in the general improvement as exploration and development efforts would likely intensify.
Silly me!I was using a 'fundamental' approach which is one I usually avoid. How many times have you come up with a great analysis of a company using all the data available, and get the whole outlook wrong?
Out of the blue, a shock news event, such as a Serious Fraud Office investigation, hits the wires – and all of your careful analysis is for nought as the shares take a massive hit.And that is exactly what happened here.
Back to the chart. Although the market did attempt to rally, it hit the brick wall of the major blue trendline, and it just gave up and remained in its major bear trend.
So, then the fog was clearing a little, and I could count a potential five-down off the 2012 highs.
Now, this bear trend turns out to be a typical Elliott impulsive pattern with wave 2 a three-up to a large retrace of wave 1 down.Then, wave 3 was long and strong and wave 4 a lengthy complex wedge affair which I got caught up in.As I discovered last time, fourth waves are notoriously tricky to map in real time.
But at least the final wave-4 high was made from a precise hit on the upper pink wedge line which is the ideal entry point for a low-risk short trade.
The very sharp wave-5 decline was accompanied by that Serious Fraud Office investigation, as outlined by Edmond.It made a low of £3.50 last June and has spent the last year pulling itself up by its bootstraps to the current £5.50 area.
Along the way, it has managed to hit my major blue trendline and bounce down off that resistance and appears ready to test it again.Here is the daily:
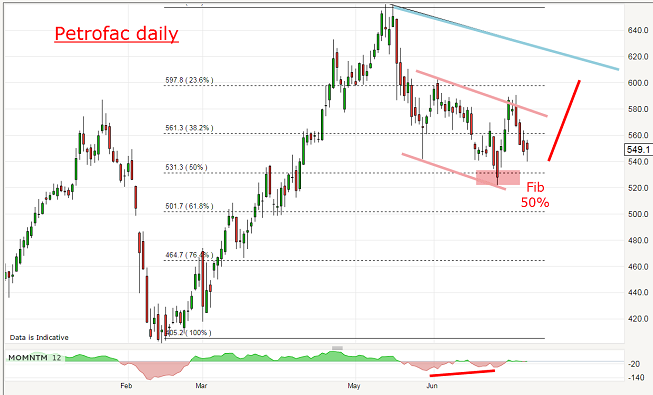
Source: interactive investor Past performance is not a guide to future performance
The dip off the blue trendline is a three-down (corrective) to the Fib 50% support on a momentum divergence.This is my ideal set-up!
Long trades here could be protected by a stop just below recent low in the £5.20 area.
John Burford is the author of the definitive text on his trading method, Tramline Trading. He is also a freelance contributor and not a direct employee of interactive investor.
These articles are provided for information purposes only. Occasionally, an opinion about whether to buy or sell a specific investment may be provided by third parties. The content is not intended to be a personal recommendation to buy or sell any financial instrument or product, or to adopt any investment strategy as it is not provided based on an assessment of your investing knowledge and experience, your financial situation or your investment objectives. The value of your investments, and the income derived from them, may go down as well as up. You may not get back all the money that you invest. The investments referred to in this article may not be suitable for all investors, and if in doubt, an investor should seek advice from a qualified investment adviser.
Full performance can be found on the company or index summary page on the interactive investor website. Simply click on the company's or index name highlighted in the article.