Chart of the week: The next big trade for Apple shares
18th June 2018 11:17
Is Apple about to fall?
Apple Inc shares is a core holding for many funds as well as private portfolios. And no wonder - it has been a stellar performer over recent years as very expensive new product after very expensive new product has been greeted with an almost rapturous welcome in most countries (with the notable exception of China).
But just as no tree (no matter how vigorous) can grow to the sky, no share can keep its bull run alive for ever. At some point in time, its sky-high valuation must run into a brick wall as either general market conditions turn less favourable, or investors believe there is little upside left and there are better opportunities elsewhere.
And technical traders - myself included - pounce on chart signals and assume a contrarian mantle in pursuit of a profit.
Of course, many remain wedded to the Apple story - and will remain so even if the shares drop by 20%, or 40% or even more. Most will not countenance today such a drop and it is a perverse feature of public markets that just when a majority remain so complacent that the market usually starts a decline - some times a major one.
Are we at such a stage in the Apple saga? Odds are rapidly growing we could well be - and here is my case.
This is the weekly chart from the wave 4 low in late 2016
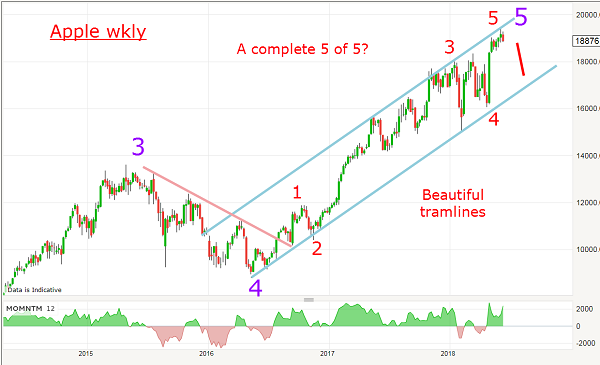
Source: interactive investor Past performance is not a guide to future performance
And from that low, I have a beautiful tramline pair working. Remember, these are lines of support (lower) and resistance (upper). They remain valid until one of them is broken through. In a rising pair, it is usually the lower line that breaks.
And the rally off that low is in a clear five waves with my wave 5 of 5 just recently hitting the upper tramline at the $195 level. Recall, when a five wave up sequence completes, the market turns down, no matter what the ‘fundamentals’ tell you.
And here is a close-up of the final red wave 5 on the 4-hr chart (as of Friday close).
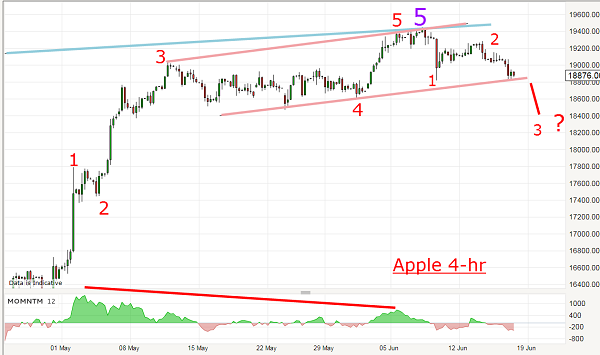
Source: interactive investor Past performance is not a guide to future performance
Not only did the market hit the upper blue tramline resistance on 7 June, but it also hit my upper pink minor tramline – and close Friday on the lower line. Note the huge momentum divergence at that high, which signals a possible sharp move lower if it can break hard below the lower pink tramline.
So all my ducks are lined up in a row for a potential hard break – but where is a reasonable first target?
If it goes to plan, it must be the lower blue tramline in the $160 area. My upside line in the sand is the high at $195. That makes a potential profit/loss trade ratio at $28/$7, or 4:1 which is a decent return.
Of course, if the $160 target is reached, there is potential for further losses, given time.
Naturally, the market could trace out more upside, but it would take a tremendous buying surge to push it above the old high, which looks increasingly unlikely.
John Burford is the author of the definitive text on his trading method, Tramline Trading.
These articles are provided for information purposes only. Occasionally, an opinion about whether to buy or sell a specific investment may be provided by third parties. The content is not intended to be a personal recommendation to buy or sell any financial instrument or product, or to adopt any investment strategy as it is not provided based on an assessment of your investing knowledge and experience, your financial situation or your investment objectives. The value of your investments, and the income derived from them, may go down as well as up. You may not get back all the money that you invest. The investments referred to in this article may not be suitable for all investors, and if in doubt, an investor should seek advice from a qualified investment adviser.
Full performance can be found on the company or index summary page on the interactive investor website. Simply click on the company's or index name highlighted in the article.
Disclosure
We use a combination of fundamental and technical analysis in forming our view as to the valuation and prospects of an investment. Where relevant we have set out those particular matters we think are important in the above article, but further detail can be found here.
Please note that our article on this investment should not be considered to be a regular publication.
Details of all recommendations issued by ii during the previous 12-month period can be found here.
ii adheres to a strict code of conduct. Contributors may hold shares or have other interests in companies included in these portfolios, which could create a conflict of interests. Contributors intending to write about any financial instruments in which they have an interest are required to disclose such interest to ii and in the article itself. ii will at all times consider whether such interest impairs the objectivity of the recommendation.
In addition, individuals involved in the production of investment articles are subject to a personal account dealing restriction, which prevents them from placing a transaction in the specified instrument(s) for a period before and for five working days after such publication. This is to avoid personal interests conflicting with the interests of the recipients of those investment articles.
Editor's Picks