Chart of the Week: Is the Next rally nixed?
6th August 2018 13:44
by John Burford from interactive investor
Share on
Having seen Next reward his contrarian approach in recent months, technical analyst John Burford reveals why he's not overstaying his welcome.

With the UK retail clothing sector pretty much in continued dire straits (partly from the 'Amazon Effect'), Next has been valiantly swimming against the tide almost single-handedly with good gains racked up in recent weeks.
But that is exactly what I foresaw back in May when I last covered it, where I offered specific price targets. That was a truly contrarian forecast with sentiment so bearish.
So did I have a crystal ball to enable that bullish prediction to come to pass? Did I scour the company financials or perform retail sector analysis to glean insights into the strength of the company? Did I even use astrology to discover favourable aspects with planetary conjunctions? Or did I maybe have a wild guess?
Curiously, these are methods some use to determine their investment strategies.
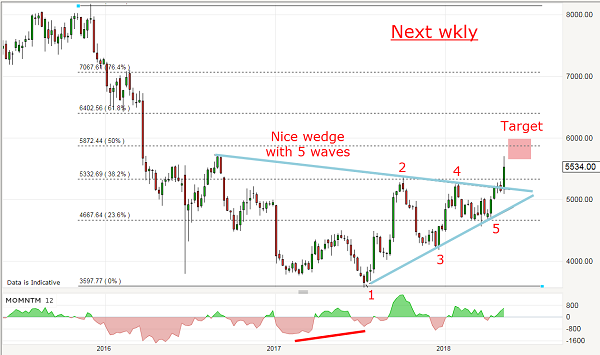
No, all I used was this chart of historic price action posted in my Chart of the Week of 14 May and a sense of the bearish sentiment extreme at the 2017 lows.
Source: interactive investor Past performance is not a guide to future performance
This chart held valuable clues that enabled me to make accurate future price movements.
Recall that gloom and doom stories had been swishing around prominent retailers for some time and seemed to reach a crescendo about a year ago when Marks & Spencer Group reported poor sales and the shares plunged to almost match their 2009 credit crunch lows around £2.50.
That was the time when Next shares dropped to the £35.50 lows (wave 1 on above chart). But with bullish sentiment on the floor, was this a great time to be buying in true contrary fashion?
If you followed the usual ‘fundamental’ approach, the answer would be Definitely Not.
But from that low, the shares staged a ‘surprise’ relief rally and in December, I was able to buy at £44 on an A-B-C pull-back in true 'Buy the Dip' style using a close stop.
And by May, I could set upper price targets based on the shape of the price patterns in the above chart. My first target was the Fibonacci 50% level (pink zone) around £58.
Recall the 50% retrace is a significant resistance zone where reversals often occur. Thus, it is usually a good place to at least consider taking some profits. Your decision should include analysis of the character of the advance off the low.
This is what I wrote then:
"Prudence tells me to take at least some profit as a major target is within range. That is a cool gain of £12 (28%). But is there more upside?"
It presented a problem – but a nice one to have. I continued:
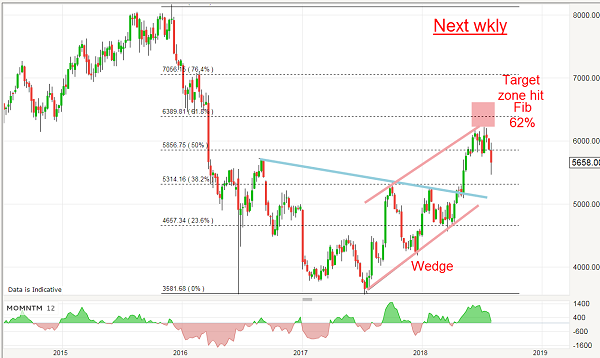
"I have to note the weakening momentum into the current rally as a warning sign. But so far, the immediate trend remains up and there should be more fuel in the tank to perhaps push it up to the Fib 62% retrace around the £64 area."
So was I lucky to see the Fib 62% target hit around the £64 area in June? This is the updated weekly chart:
Source: interactive investor Past performance is not a guide to future performance
Bingo! Not only did I achieve the Fib 50% target but also the Fib 62% zone where full profits were taken.
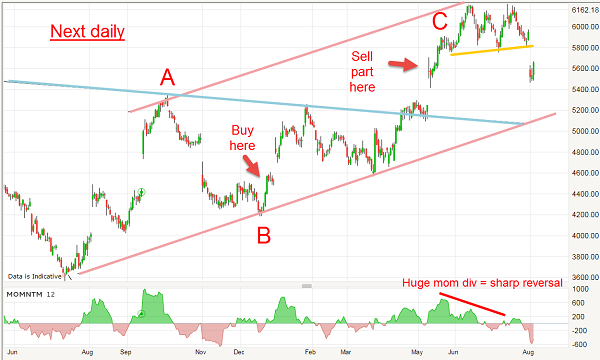
Of course, the weekly chart is too coarse-grained for precise trade entries and exits so I used the daily for a more accurate analysis. Here is the daily from the 2017 low:
Source: interactive investor Past performance is not a guide to future performance
As the market climbed above the first Fib 50% target in June, I could then draw in likely tramlines (in pink) which projected the market would likely hit the upper line as it then would run into stiff resistance.
Also, the form of the advance is a clear three up – and that is always corrective and a clue to expect a renewed decline.
When trading A-B-C corrections, it is usually unwise to overstay your welcome.
Then, as the market began testing the resistance in the £62 - £64 zone, I noted the very large momentum divergence was building — and that was a clear warning sign the advance was running out of steam. I had better take the remaining profit there or risk a ‘sharp reversal’. I exited at the £60 level.
The entire campaign netted a profit of £12 on the first leg and £16 on the remainder – magnified many times when spread betting, of course.
And last week, the market began moving down off my target and broke a minor internal trendline (yellow) where many sell stops were obviously placed. And it appears highly likely the lower wedge line will be tested soon in the £60 area.
Of course, the smart follow-on play was to reverse positions in anticipation of a new down trend (I missed that one!).
John Burford is the author of the definitive text on his trading method, Tramline Trading. He is also a freelance contributor and not a direct employee of interactive investor.
These articles are provided for information purposes only. Occasionally, an opinion about whether to buy or sell a specific investment may be provided by third parties. The content is not intended to be a personal recommendation to buy or sell any financial instrument or product, or to adopt any investment strategy as it is not provided based on an assessment of your investing knowledge and experience, your financial situation or your investment objectives. The value of your investments, and the income derived from them, may go down as well as up. You may not get back all the money that you invest. The investments referred to in this article may not be suitable for all investors, and if in doubt, an investor should seek advice from a qualified investment adviser.
Full performance can be found on the company or index summary page on the interactive investor website. Simply click on the company's or index name highlighted in the article.
Disclosure
We use a combination of fundamental and technical analysis in forming our view as to the valuation and prospects of an investment. Where relevant we have set out those particular matters we think are important in the above article, but further detail can be found here.
Please note that our article on this investment should not be considered to be a regular publication.
Details of all recommendations issued by ii during the previous 12-month period can be found here.
ii adheres to a strict code of conduct. Contributors may hold shares or have other interests in companies included in these portfolios, which could create a conflict of interests. Contributors intending to write about any financial instruments in which they have an interest are required to disclose such interest to ii and in the article itself. ii will at all times consider whether such interest impairs the objectivity of the recommendation.
In addition, individuals involved in the production of investment articles are subject to a personal account dealing restriction, which prevents them from placing a transaction in the specified instrument(s) for a period before and for five working days after such publication. This is to avoid personal interests conflicting with the interests of the recipients of those investment articles.