Chart of the week: Party-time or bear market bounce?
Fighting back from a brutal sell-off, our charts analyst reveals how far this high-profile share can go.
4th February 2019 11:51
by John Burford from interactive investor
Share on
Fighting back from a brutal sell-off, our charts analyst reveals how far this high-profile share can go.

Can Facebook regain its mojo?
Until recently, Facebook (NASDAQ:FB) was considered a wonderful 'free' platform for people to connect. Family and friends, wherever they were on the globe, could send photos and messages to anyone else who was 'on' Facebook. What could possibly go wrong with that?
The share market soared with such bullish enthusiasm for the future of communication in social media – and the profit potential for attracting advertisers into this new media.
But then, last year, it was discovered that many of the wrong kinds of people were connecting, especially to the young. Stories emerged of terrorists recruiting our youth, child molesters arranging meetings, and so on. And now, revelations about the huge number of 'fake' accounts are emerging.
Suddenly, social media is increasingly seen as 'evil' and today, the mainstream media is replete with stories of the harm it is doing. Rarely, if ever, do you see a positive slant. It is rapidly turning into anti-social media.
I believe sentiment turned in July last year. Facebook's July company results showed a decent earnings report, but the Cambridge Analytica scandal demonstrated one of the negative sides to social media.
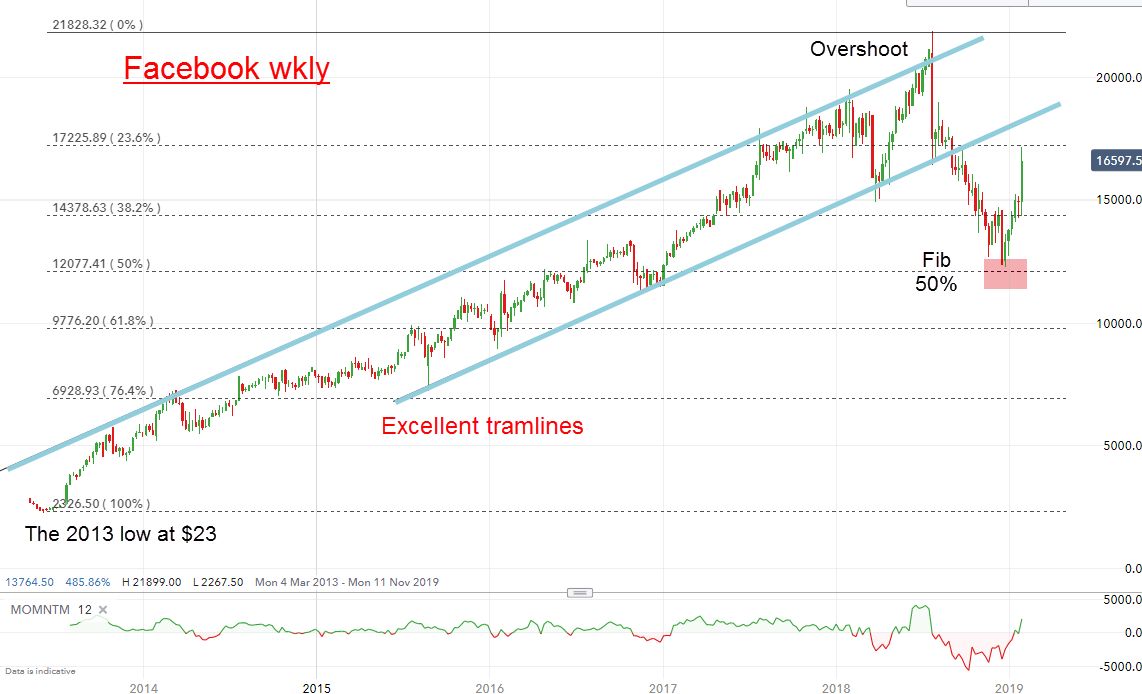
This is the weekly chart since the 2013 low:
Source: interactive investor Past performance is not a guide to future performance
The multi-year bull market off that low traversed the trading channel between my tramlines in textbook style. The first and only meaningful stray out of the channel occurred in July last year when the market spiked up and then retreated hard back inside the channel in what I call an 'overshoot'.
When coming at the end of a lengthy trend, an overshoot normally heralds a rapid retreat back to the lower tramline – and a shorting opportunity. And that is precisely what occurred. Then, in September, it broke hard below the lower tramline to confirm the change in main trend to down.
The decline stopped at the Fibonacci 50% retrace of the entire bull run at $123 – a normal-sized correction. And now, it is back in rally mode. But is it party-time again or is this a bear market bounce?
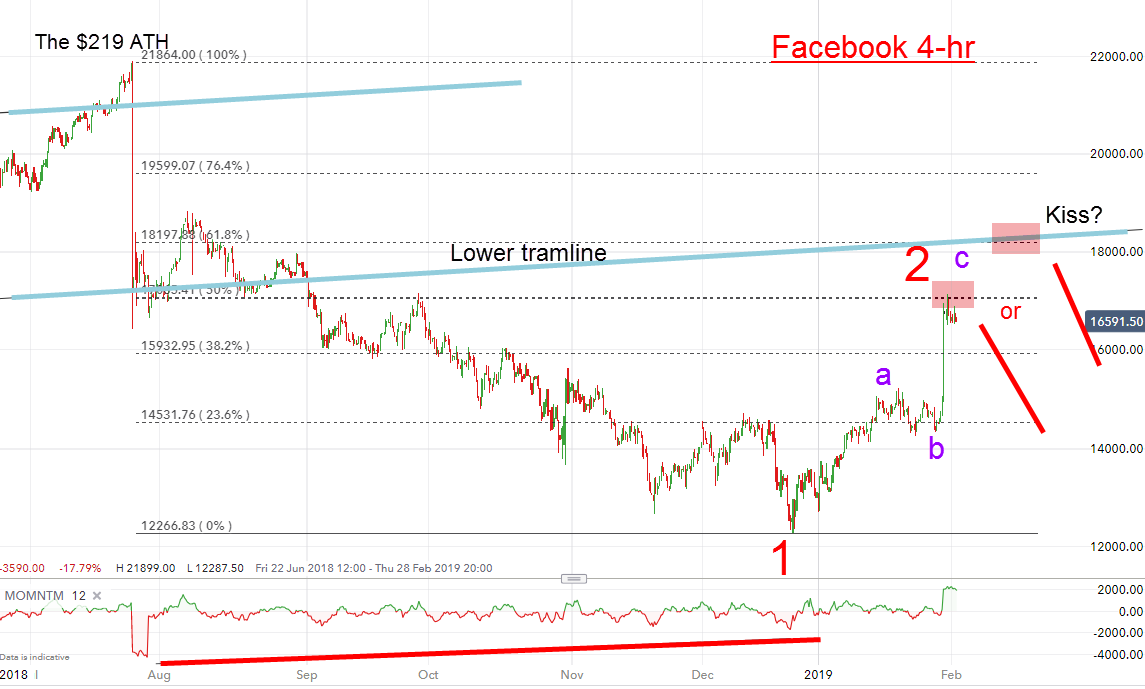
For more clues, here is a close-up of the move off the all-time high:
Source: interactive investor Past performance is not a guide to future performance
Note the momentum divergence leading into the wave 1 low and the a-b-c from there to the current rally. Three-wave patterns are always counter-trend and when this one tops out, odds favour a resumption of the downtrend.
That could occur here (latest $166) at the Fibonacci 50% retrace or perhaps a little higher at the Fibonacci 62% retrace where it would kiss the underside of the lower tramline at the $180 area.
Only a push up past $180 would put a dent in my bearish outlook.
For more information about Tramline Traders, or to take a three-week free trial, go to www.tramlinetraders.com.
John Burford is the author of the definitive text on his trading method, Tramline Trading. He is also a freelance contributor and not a direct employee of interactive investor.
These articles are provided for information purposes only. Occasionally, an opinion about whether to buy or sell a specific investment may be provided by third parties. The content is not intended to be a personal recommendation to buy or sell any financial instrument or product, or to adopt any investment strategy as it is not provided based on an assessment of your investing knowledge and experience, your financial situation or your investment objectives. The value of your investments, and the income derived from them, may go down as well as up. You may not get back all the money that you invest. The investments referred to in this article may not be suitable for all investors, and if in doubt, an investor should seek advice from a qualified investment adviser.
Full performance can be found on the company or index summary page on the interactive investor website. Simply click on the company's or index name highlighted in the article.
Disclosure
We use a combination of fundamental and technical analysis in forming our view as to the valuation and prospects of an investment. Where relevant we have set out those particular matters we think are important in the above article, but further detail can be found here.
Please note that our article on this investment should not be considered to be a regular publication.
Details of all recommendations issued by ii during the previous 12-month period can be found here.
ii adheres to a strict code of conduct. Contributors may hold shares or have other interests in companies included in these portfolios, which could create a conflict of interests. Contributors intending to write about any financial instruments in which they have an interest are required to disclose such interest to ii and in the article itself. ii will at all times consider whether such interest impairs the objectivity of the recommendation.
In addition, individuals involved in the production of investment articles are subject to a personal account dealing restriction, which prevents them from placing a transaction in the specified instrument(s) for a period before and for five working days after such publication. This is to avoid personal interests conflicting with the interests of the recipients of those investment articles.