Chart of the week: A potentially huge moment for BT shares
18th December 2017 12:59
by John Burford from interactive investor
Share on
BT is finally showing signs of life
When I last covered on 2 October, they had reached an important point at 284p which was very close to a Fibonacci 50% retrace of the entire bear trend off the 2016 high.
This was the chart I showed then:
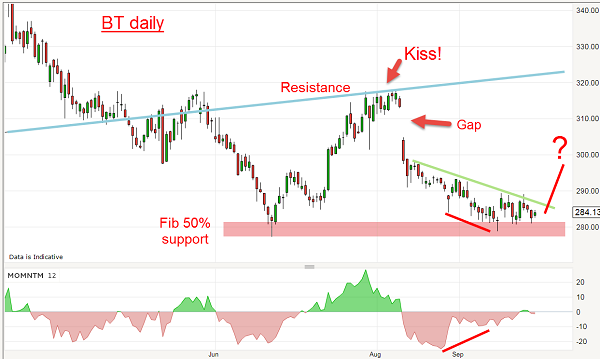
Because sentiment towards the company was super-bearish pretty much all year, I was looking for a major low in order to establish one of my trademark contrarian long trades.
Of course, many traders try a contrarian approach, but unless you have a solid technique, it is so easy to enter your trade well before the low (this can occur to all of us, of course). And if you do not use a close stop loss, heavy losses can ensue that may or may not be recovered.
Back in October, I noted that I would only consider buying if a certain event took place. On the above chart, I had drawn a pale blue trendline.
The momentum was forming a divergence into the Fib 50% support and it was looking good for a reversal which would be confirmed on a push above the trendline.
That was where a buy stop could be entered to get you into a long trade. In the event, did that happen? Here is the updated chart:
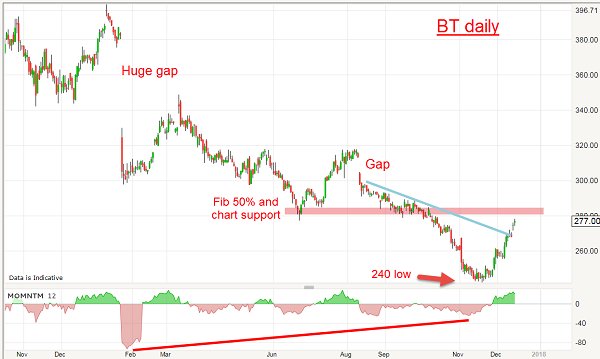
No, not then, so no trade was triggered. That was a prudent move, since, if we had just jumped in, we would have suffered a nasty hit.
The market fell off another cliff into November, but then reversed off the late November lows and has now broken above the blue trendline and is heading for the pink zone which is now resistance.
The low so far is 240p, so was there a way to estimate with any confidence that the actual low was to be in this area? Here is the long term monthly chart:
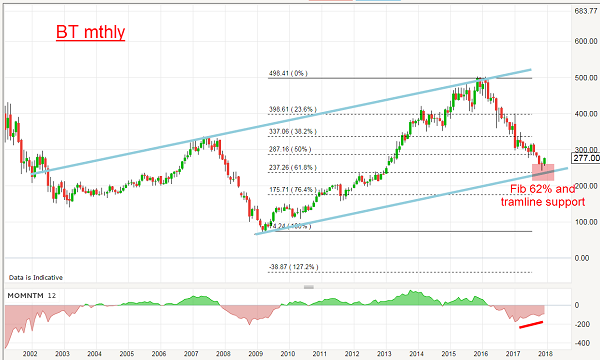
I have an excellent tramline pair over the 15-year period of trading and at the 240p low, the market hit the meeting of the Fibonacci 62% (a common turning point) and the lower tramline support. Isn't that pretty?
The very long memory possessed by many of the very largest participation public markets continues to astonish me.
In addition, even on this monthly scale, you can see the momentum divergence at the low and that signals a healthy recovery phase is likely ahead. That places the 240p low as a high probability low.
If we refer back to the daily chart, there are some overhead gaps - and gaps act like magnets. Most of them eventually get filled.
Provided the shares can push up past the 280p level resistance (after perhaps a pull-back to the 260-270p area), my first target is the 300-320p area. And above that, the huge January gap at the 360-380p area comes into focus.
My stop loss is in the 240p area, but will raise it if/when the shares trade above the 290p area.
Wishing all my readers a very Happy Christmas and a most prosperous New Year!
This article is for information and discussion purposes only and does not form a recommendation to invest or otherwise. The value of an investment may fall. The investments referred to in this article may not be suitable for all investors, and if in doubt, an investor should seek advice from a qualified investment adviser.
These articles are provided for information purposes only. Occasionally, an opinion about whether to buy or sell a specific investment may be provided by third parties. The content is not intended to be a personal recommendation to buy or sell any financial instrument or product, or to adopt any investment strategy as it is not provided based on an assessment of your investing knowledge and experience, your financial situation or your investment objectives. The value of your investments, and the income derived from them, may go down as well as up. You may not get back all the money that you invest. The investments referred to in this article may not be suitable for all investors, and if in doubt, an investor should seek advice from a qualified investment adviser.
Full performance can be found on the company or index summary page on the interactive investor website. Simply click on the company's or index name highlighted in the article.
Disclosure
We use a combination of fundamental and technical analysis in forming our view as to the valuation and prospects of an investment. Where relevant we have set out those particular matters we think are important in the above article, but further detail can be found here.
Please note that our article on this investment should not be considered to be a regular publication.
Details of all recommendations issued by ii during the previous 12-month period can be found here.
ii adheres to a strict code of conduct. Contributors may hold shares or have other interests in companies included in these portfolios, which could create a conflict of interests. Contributors intending to write about any financial instruments in which they have an interest are required to disclose such interest to ii and in the article itself. ii will at all times consider whether such interest impairs the objectivity of the recommendation.
In addition, individuals involved in the production of investment articles are subject to a personal account dealing restriction, which prevents them from placing a transaction in the specified instrument(s) for a period before and for five working days after such publication. This is to avoid personal interests conflicting with the interests of the recipients of those investment articles.