Chart of the week: Predict what FTSE 100 will do next using these clues
22nd January 2018 11:20
by John Burford from interactive investor
Share on
Technical analyst John Burford discusses record highs, big corrections and likely FTSE 100 behaviour over the next few months. It's a fascinating read.
FTSE 100 poised for more gains
Since January 2016, trading the has been far far trickier than trading the major US indexes. Here is the weekly Dow chart from January 2016.
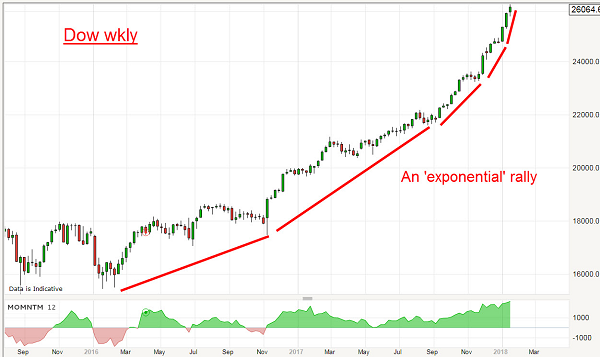
Deep corrections have been largely missing, especially since December 2016, and staying long has been one of the easiest plays I have ever experienced in a two-year period. Isn't that extraordinary?
But the FTSE has been a nightmare in comparison - and staying long has been fraught with danger - deep corrections of 10% were common. But the overall trend remained up and that was the correct stance - if you could stand the reversals.
This was where the 'buying on dips' strategy really paid off - and limited potential losses. But how do you use this strategy wisely?
In a bull trend, which the FTSE is definitely in, major waves up are always in 'fives', and major corrections down are always in 'threes'. That is one of the Elliott Wave rules which has been verified time after time.
So, from January 2016, the large wave up was a five (in green) and the March-May correction was a three (yellow). And that pattern has been repeated accurately up to today.
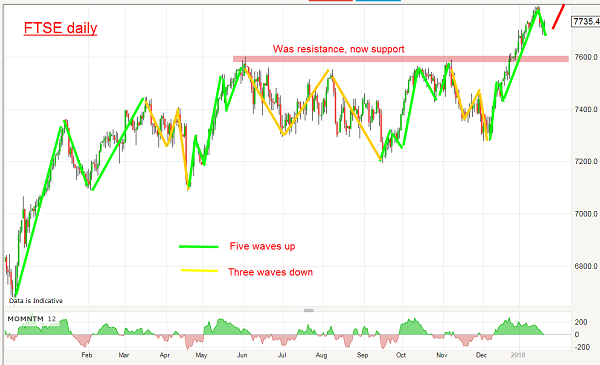
So what clues are there to suggest when the dip is over and the market ready to turn back up? One very easy one is to wait for the third wave down to exceed the low of the first wave. Then start to look for your entry that can give you a low-risk trade to your stop. I use the Fibonacci levels to aid me in this.
Let's say you are long and watched as the market pushed up firmly past the chart resistance at the 7,600 level on 21 December in a very bullish Santa Rally show of strength.
The rally from the December low is very strong and comparable with the surge exactly two years ago (far left of chart). Because I am always looking for a place to take at least some profits on strength, my analysis suggests we are very close to a major high. Here is a close-up of recent action:
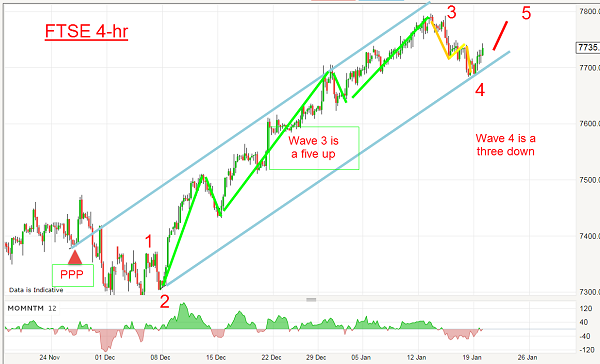
We have a long and strong section which is totally characteristic of third waves and we are just emerging from a typical three down wave 4 correction to last week's low.
I also have drawn a tramline joining waves 2 and 4, which is standard practice among Elliotticians. The upper parallel tramline starts at a Prior Pivot Point (PPP) and closely touches several highs.
The clear implication is that the market needs just one more push up in wave 5 to new highs before the entire five-up wave off the December 2016 lows can be considered complete. It could possibly reach my upper tramline in the 7,900 area (or above), depending on the shape of the sub-waves to come.
And after that? Perhaps we shall see the first decent correction of more than 10%.
A move down below the 7,680 level near-term would at least delay the above outcome. But today, odds favour my bullish scenario.
This article is for information and discussion purposes only and does not form a recommendation to invest or otherwise. The value of an investment may fall. The investments referred to in this article may not be suitable for all investors, and if in doubt, an investor should seek advice from a qualified investment adviser.
These articles are provided for information purposes only. Occasionally, an opinion about whether to buy or sell a specific investment may be provided by third parties. The content is not intended to be a personal recommendation to buy or sell any financial instrument or product, or to adopt any investment strategy as it is not provided based on an assessment of your investing knowledge and experience, your financial situation or your investment objectives. The value of your investments, and the income derived from them, may go down as well as up. You may not get back all the money that you invest. The investments referred to in this article may not be suitable for all investors, and if in doubt, an investor should seek advice from a qualified investment adviser.
Full performance can be found on the company or index summary page on the interactive investor website. Simply click on the company's or index name highlighted in the article.
Disclosure
We use a combination of fundamental and technical analysis in forming our view as to the valuation and prospects of an investment. Where relevant we have set out those particular matters we think are important in the above article, but further detail can be found here.
Please note that our article on this investment should not be considered to be a regular publication.
Details of all recommendations issued by ii during the previous 12-month period can be found here.
ii adheres to a strict code of conduct. Contributors may hold shares or have other interests in companies included in these portfolios, which could create a conflict of interests. Contributors intending to write about any financial instruments in which they have an interest are required to disclose such interest to ii and in the article itself. ii will at all times consider whether such interest impairs the objectivity of the recommendation.
In addition, individuals involved in the production of investment articles are subject to a personal account dealing restriction, which prevents them from placing a transaction in the specified instrument(s) for a period before and for five working days after such publication. This is to avoid personal interests conflicting with the interests of the recipients of those investment articles.