Chart of the week: Time to buy BT?
2nd October 2017 12:01
by John Burford from interactive investor
Share on
Sentiment towards BT appears on the floor - time to buy?
Poor old can't seem to catch a break. The mainstream media headlines about this mammoth stalwart of the have been relentlessly negative. But with the recent news that its final-salary pension arrangements with former employees will need to be trimmed if it is to stay afloat, is there finally light at the end of the tunnel?
Of course, final salary pensions have been an actuarial ticking time bomb for some time, but now Britain's largest corporate pension fund's difficulties are out in the open, despite the closure of final salary pensions to new entrants 16 years ago.
But this is not the place to discuss the future of company pensions when markets finally turn down, negative though that will be.
I last covered BT on July 31 when the shares were trading at the 310p area which was in the region of the Fibonacci 50% retrace of the entire bull run off the March 2009 Credit Crunch low. This was the monthly chart I showed:
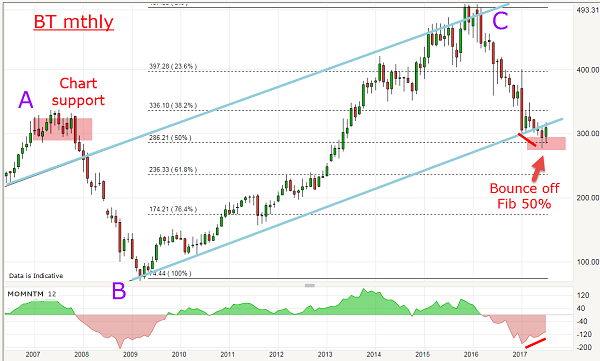
The blue lines do not qualify as precise tramlines because they do not have enough reasonably equally-spaced touch points, but I believe they are acting as support/resistance to some extent.
Given that the low of the move on 22 June at the 277p level was a precise hit on that Fibonacci support level, I suggested that the market's rally to the July 31 print at 310p could continue, provided a certain resistance level could be penetrated.
This was the close-up action on the daily chart:
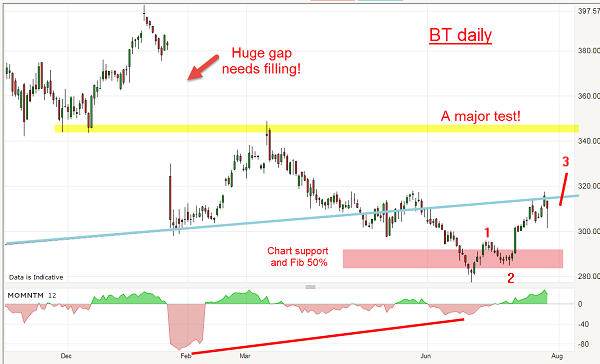
Following the decline to the close conjunction of the Fibonacci 50% support and the lower blue 'tramline', the market stayed around that zone of 280–320p for some weeks and, by July 31, was on the verge of pushing above the critical 320p level in what could be a third wave. But at this level, the market was testing the blue line resistance and, if it turned down, it would plant a kiss and cancel out my bullish wave labels.
This is what I wrote then: "Provided the 320 area can be penetrated, the next test will come at the 350 area and if that can be overcome, it would set up the likelihood the huge January gap can be filled to the 380 area."
The correct trading strategy on this basis was to place a buy 'stop' just above 320p to catch the possible thrust up. This highlights a very useful trading technique of only entering when the market has proven it wants to go in your direction.
Many traders get an idea to trade and just jump in regardless. This can work on occasion, but why jump on a horse when it might well go in the wrong direction?
So, was that trade activated? Here is the daily chart updated:
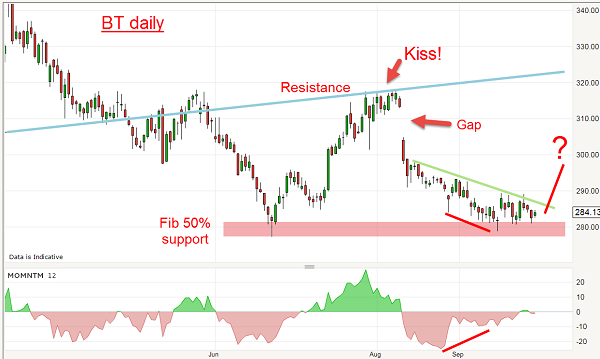
Not quite! The shares hovered around the 310p area into August to plant a kiss but then suffered another sharp decline in a scalded cat bounce to test the old low again at the 280p area. No trade was activated there - but is there an even better one here?
The decline has now set up a massive momentum divergence, and that signals a sharp weakening of selling pressure in September. Also, I have a minor green trendline that should act as support provided it can be broken to the upside. And we are in major long-term Fibonacci support. Odds are swinging to a reversal very soon.
Again, the textbook strategy is to place a buy stop just above the green line around the 290p level using the low at 275p as stop loss protection.
If successful, my first target is the gap at the 310p area. And, if the market can move above my original 320p target, higher potential exists.
Note that if the market can stage a rally from around here, we might have a double bottom reversal formation - and that would be a very bullish signal. A solid move above 320p would confirm.
This article is for information and discussion purposes only and does not form a recommendation to invest or otherwise. The value of an investment may fall. The investments referred to in this article may not be suitable for all investors, and if in doubt, an investor should seek advice from a qualified investment adviser.
These articles are provided for information purposes only. Occasionally, an opinion about whether to buy or sell a specific investment may be provided by third parties. The content is not intended to be a personal recommendation to buy or sell any financial instrument or product, or to adopt any investment strategy as it is not provided based on an assessment of your investing knowledge and experience, your financial situation or your investment objectives. The value of your investments, and the income derived from them, may go down as well as up. You may not get back all the money that you invest. The investments referred to in this article may not be suitable for all investors, and if in doubt, an investor should seek advice from a qualified investment adviser.
Full performance can be found on the company or index summary page on the interactive investor website. Simply click on the company's or index name highlighted in the article.
Disclosure
We use a combination of fundamental and technical analysis in forming our view as to the valuation and prospects of an investment. Where relevant we have set out those particular matters we think are important in the above article, but further detail can be found here.
Please note that our article on this investment should not be considered to be a regular publication.
Details of all recommendations issued by ii during the previous 12-month period can be found here.
ii adheres to a strict code of conduct. Contributors may hold shares or have other interests in companies included in these portfolios, which could create a conflict of interests. Contributors intending to write about any financial instruments in which they have an interest are required to disclose such interest to ii and in the article itself. ii will at all times consider whether such interest impairs the objectivity of the recommendation.
In addition, individuals involved in the production of investment articles are subject to a personal account dealing restriction, which prevents them from placing a transaction in the specified instrument(s) for a period before and for five working days after such publication. This is to avoid personal interests conflicting with the interests of the recipients of those investment articles.