Chart of the week: Vodafone shares at crucial level
4th September 2018 10:20
by John Burford from interactive investor
Share on
Trading Vodafone profitably has been problematic, so technical analyst John Burford tells us when to accept a loss and reveals where a base for a rally phase may be.

Vodafone buy signal was wrong – here's how to avoid a big loss
In my COTW of 30 July, I laid out my bullish case for Vodafone and suggested a low risk trade entry around the current £1.80 area. Sadly, 'low risk' does not mean 'no risk' - and that is why using a sensible stop loss strategy is always strongly advised.
So instead of using the usual format of 'what shares to buy', I will today lay out my own methods for deciding when and where it is advisable to take a small loss if the market fails to follow your roadmap. I believe having a solid stop loss strategy is a lot more important than honing your particular method of analysis.
It is said that getting into a trade is a whole lot easier than getting out – and that applies just as much to a profit situation as it does to losses.
My view is that it is no shame to judge a market wrongly. Is there any trader/investor out there that has never been in a losing position on a share? But what is shameful is to take a big hit on a loser. That I refuse to do as much as is humanly possible.
This is how I played the Vodafone setback.
The setup appeared very promising and this was the daily chart I showed last month:
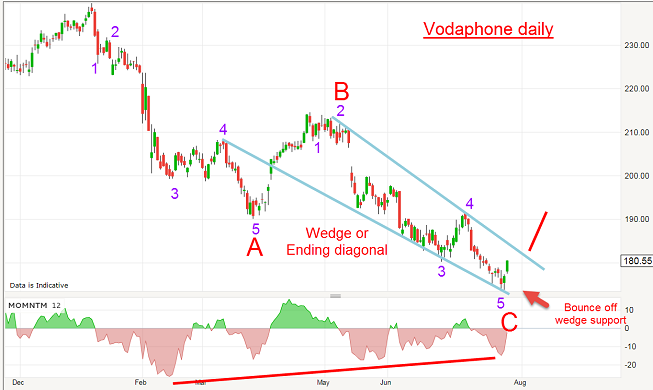
Source: interactive investor Past performance is not a guide to future performance
The wave labels looked good and the A-B-C three down is always a counter-trend move especially given the large momentum divergence. The wedge in wave C also appeared valid as an 'ending diagonal', which is a reversal pattern.
The placement of the stop loss was quite simple - just below the low at £1.73. If the market did move down to that level, it would invalidate my wave labels.
The buy at £1.80 was thus protected by a stop loss at £1.73 for a potential loss of 7p.
So, all was set for a good rally – and this is how it played out on the 4-hr chart:
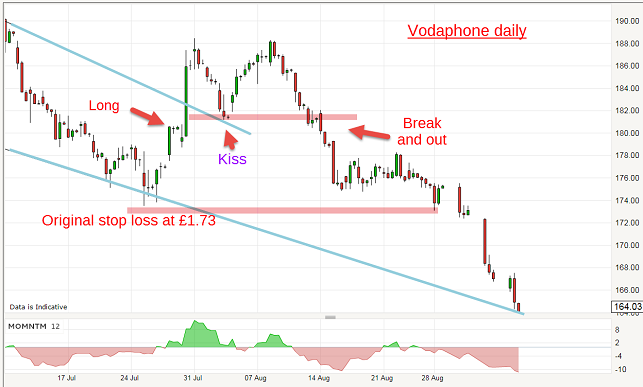
Source: interactive investor Past performance is not a guide to future performance
After the buy at £1.80 the market surged and broke above the wedge line, as I had expected. So far, so good. And then dipped to plant a kiss on the upper wedge line, which is entirely normal after a trendline break.
Then, the market pushed up again as expected, but crucially started to lose altitude and approached the price level of the kiss. Whenever a market does this trick, it is not a good sign. The chart has traced out a "V" pattern and whenever it does that, I am quick to raise my stop loss to just under the point of the "V". And as it broke lower, it took out my stop at the £1.80 area for a break-even trade.
From experience, I know the odds had changed on that break and no longer support a bullish stance.
Since then, the market has just fallen out of bed and has retreated back to the lower wedge line which should provide some support at least.
Now if you had left your stop loss alone, you would be down by 7p, instead of the 16p loss currently available – a much more satisfactory position. The crucial point is this: When you are out of the market, you are in a much better state of mind to re-assess than when you are nervously staring at a big open loss.
So how does the setup look now?
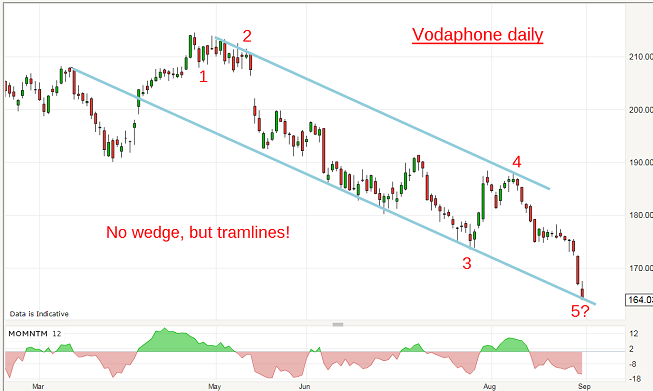
Source: interactive investor Past performance is not a guide to future performance
In fact, the wedge has gone and I now have a good tramline pair (with parallel lines) where the upper line clips the wave 4 high. If this level at £1.64 can hold, we may have a base for the rally phase I had originally pencilled in back in July.
But what is spoiling this picture is the lack of a momentum divergence. That may be crucial.
John Burford is the author of the definitive text on his trading method, Tramline Trading. He is also a freelance contributor and not a direct employee of interactive investor.
These articles are provided for information purposes only. Occasionally, an opinion about whether to buy or sell a specific investment may be provided by third parties. The content is not intended to be a personal recommendation to buy or sell any financial instrument or product, or to adopt any investment strategy as it is not provided based on an assessment of your investing knowledge and experience, your financial situation or your investment objectives. The value of your investments, and the income derived from them, may go down as well as up. You may not get back all the money that you invest. The investments referred to in this article may not be suitable for all investors, and if in doubt, an investor should seek advice from a qualified investment adviser.
Full performance can be found on the company or index summary page on the interactive investor website. Simply click on the company's or index name highlighted in the article.
Disclosure
We use a combination of fundamental and technical analysis in forming our view as to the valuation and prospects of an investment. Where relevant we have set out those particular matters we think are important in the above article, but further detail can be found here.
Please note that our article on this investment should not be considered to be a regular publication.
Details of all recommendations issued by ii during the previous 12-month period can be found here.
ii adheres to a strict code of conduct. Contributors may hold shares or have other interests in companies included in these portfolios, which could create a conflict of interests. Contributors intending to write about any financial instruments in which they have an interest are required to disclose such interest to ii and in the article itself. ii will at all times consider whether such interest impairs the objectivity of the recommendation.
In addition, individuals involved in the production of investment articles are subject to a personal account dealing restriction, which prevents them from placing a transaction in the specified instrument(s) for a period before and for five working days after such publication. This is to avoid personal interests conflicting with the interests of the recipients of those investment articles.