Chart of the week: Is Warren Buffett about to sink or swim?
11th June 2018 11:55
by John Burford from interactive investor
Share on
The most prominent investment guru globally has to be Warren Buffett. His pearls of wisdom are cherished by mom 'n pop retail investors who try hard to emulate his success - usually unsuccessfully (emotion gets in the way).
He has been the beneficiary of the huge increase in asset valuations in recent decades. But in common with all of us, he and sidekick Munger have made some big errors, including missing out on the dotcom boom of the 1990s when he claimed he did not understand it (did anyone?).
As a trader, I do not understand the ins and outs of the economy of gold mining, but I am willing to trade it if I can see a profit!
His style is to buy and hold into high potential value companies that are mispriced. And rarely sell them.
He has recently revealed the top 15 holdings and only Apple Inc appears as the lone tech listing – many of the others are US banks with Wells Fargo & Co at the top (Bank of America is third).
As such, his investment vehicle Berkshire Hathaway Inc A has more or less mirrored the general US stockmarket performance in the S&P index.
I look upon its performance as a litmus test of the general US market – and economy. As and when the general market conditions turn down, the shares will reflect that by leading the way.
The shares made a high of $22,000 on 29 January and have not exceeded that print since. So, is that an early warning sign that the general market has turned and poised to move lower?
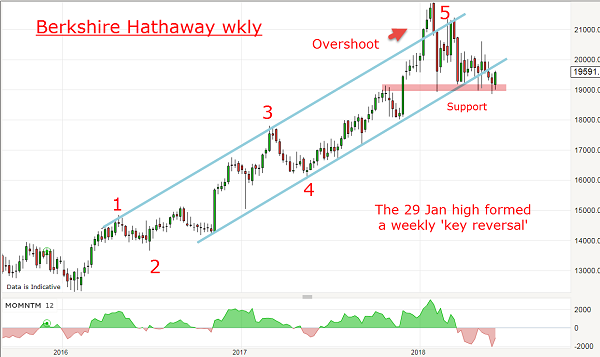
Here is the weekly chart from 2016:
Source: interactive investor Past performance is not a guide to future performance
The first feature to note is my magnificent blue tramlines that have captured all of the trading – until the January ‘Overshoot’. It is a valid overshoot because the market rapidly dipped back under the upper tramline, then rallied to kiss it before falling back again.
The second feature is the five Elliott wave advance off the 2016 low with the fifth wave overshoot a buying climax, resulting in a weekly key reversal that normally heralds a trend change after a long trending run.
And the third feature is the break of the lower tramline and a bounce off the pink major support zone around 19,000.
These three features point to a major trend change has occurred.
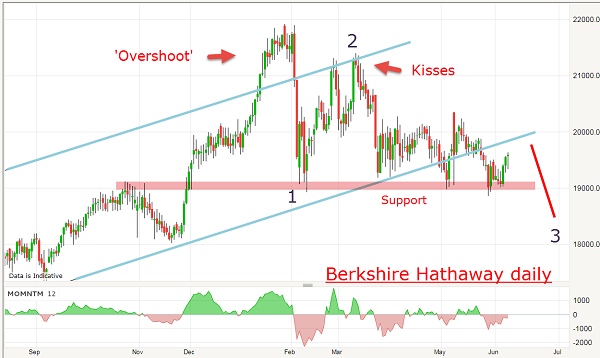
Here is the recent action on the daily chart:
Source: interactive investor Past performance is not a guide to future performance
This is a valid Elliott wave option where we are about to see a break of the 19,000 support zone and plunge lower in wave 3. Remember, third wave are usually long and strong.
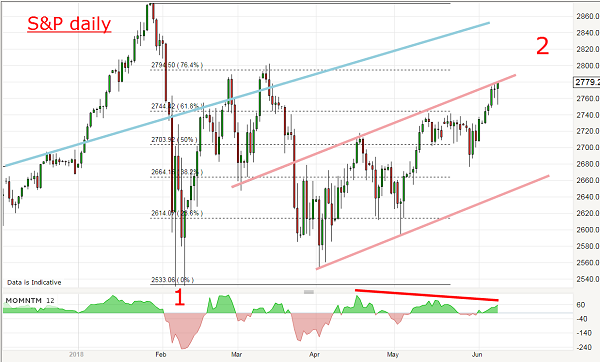
But let's hold our horses a while - here is the S&P 500 chart which BRK should closely follow:
Source: interactive investor Past performance is not a guide to future performance
Because BRK holds largely shares that are listed in this index, the share price should more or less move with it. And that observation holds pretty accurately – until the past few weeks when they have notably diverged. BRK has severely underperformed.
So, has Buffett hit the buffers?
If the S&P turns down from the upper pink tramline near here, BRK will surely follow and break under the 19,000 support to follow my roadmap above. And that would be a great place to short as the third wave gathers pace.
In the meantime, bullish hopes are alive with the markets expecting great things to happen from this week’s events, including the Trump/Un summit and the monthly Fed interest rate announcement on Wednesday.
John Burford is the author of the definitive text on his trading method, Tramline Trading.
These articles are provided for information purposes only. Occasionally, an opinion about whether to buy or sell a specific investment may be provided by third parties. The content is not intended to be a personal recommendation to buy or sell any financial instrument or product, or to adopt any investment strategy as it is not provided based on an assessment of your investing knowledge and experience, your financial situation or your investment objectives. The value of your investments, and the income derived from them, may go down as well as up. You may not get back all the money that you invest. The investments referred to in this article may not be suitable for all investors, and if in doubt, an investor should seek advice from a qualified investment adviser.
Full performance can be found on the company or index summary page on the interactive investor website. Simply click on the company's or index name highlighted in the article.
Disclosure
We use a combination of fundamental and technical analysis in forming our view as to the valuation and prospects of an investment. Where relevant we have set out those particular matters we think are important in the above article, but further detail can be found here.
Please note that our article on this investment should not be considered to be a regular publication.
Details of all recommendations issued by ii during the previous 12-month period can be found here.
ii adheres to a strict code of conduct. Contributors may hold shares or have other interests in companies included in these portfolios, which could create a conflict of interests. Contributors intending to write about any financial instruments in which they have an interest are required to disclose such interest to ii and in the article itself. ii will at all times consider whether such interest impairs the objectivity of the recommendation.
In addition, individuals involved in the production of investment articles are subject to a personal account dealing restriction, which prevents them from placing a transaction in the specified instrument(s) for a period before and for five working days after such publication. This is to avoid personal interests conflicting with the interests of the recipients of those investment articles.