Chart of the week: When to buy this tech titan
30th October 2017 11:03
Is Twitter still for the birds?
Unlike most of its US tech giant brethren, has been a dead duck for investors in recent years. From its IPO just about four years ago at $26, it briefly dipped below $26 and then zoomed up to the $75 high on Christmas Eve 2013 before starting a massive bear run to a spike low at $13 in December last year.
Of course, there was every reason to be down on the stock – it hasn't generated a penny in profit since its IPO! And investors, burned by the Tech Bust of the 1990s, wanted this time to see some profits. Show me the money! Incidentally, that little matter of chronic losses hasn't stopped TESLA from being rocketed into the stratosphere (I hope to cover this share here soon).
But with the latest news that it may become profitable in Q4 and user numbers are now growing (being led as I am sure by President Trump), the market is suddenly taking another look – and I believe so should we. Also of note is the large short interest at about 8% of outstanding equity.
Here is the weekly chart:
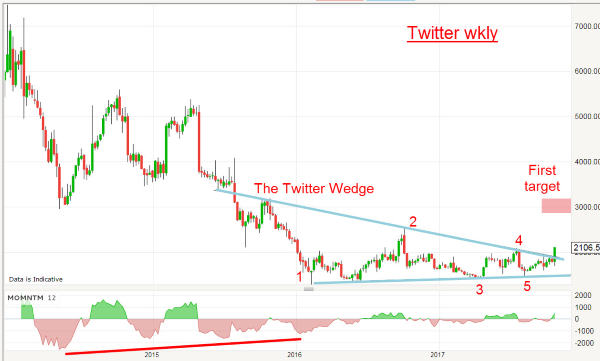
The decline has been a real roller-coaster with Elliott waves difficult to label, but now the fog is clearing, and I have a textbook wedge with five clear sub-waves and both wedge lines are sporting very accurate touch points. The upper one also has a nice Prior Pivot Point (PPP) that solidifies that line as a valid line of resistance for waves 2 and 4.
But with Friday's surge to $21, we now have a clear break of that resistance line and that transforms it into a solid line of support. Here is a close-up:
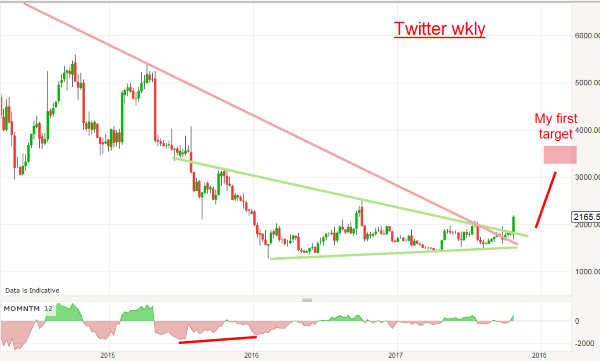
With the large momentum divergence at the December 2016 low, I have a wedge that has been forming for over a year, and my outlook is that the rally will be strong. It's as if the market has been coiling ever tighter for a year and its pent-up energy is now about to be released.
With the large short interest component that would provide extra rocket fuel to send the shares sharply higher in a short squeeze, the potential is high for my initial target at the $30 level to be attained rapidly. That is the area where the wedge started and is a typical target for wedge breakaway moves.
Then, I have a Fibonacci 50% target at around $35, which is my first major target.
If the market dips towards the upper wedge line at around $19 in the next few days – in a typical re-test of that support - I would be a buyer and use the recent low at $17 as my stop. In any case, I believe the odds are high for the rally to continue especially if the major Nasdaq market can maintain its rally – and the outlook there is good. Here is the Nasdaq chart:
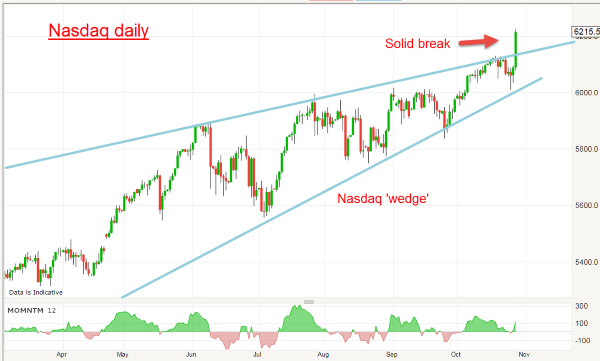
I have placed long-term blue wedge lines and the market, likewise, was coiling in a spring. If it had broken below the lower line of support, the trend would have likely changed. But, on Friday, it did nothing of the sort and powered hard above the upper line of resistance to confirm the continuation of the up-trend. That cancelled out any notion of a trend change! So far.
OUTLOOK:
Twitter shares should attain $30 and then $35 area with a possible dip to $19 first. Stop area is $17. Could possibly move above $35, but I will need to examine the wave patterns first.
This article is for information and discussion purposes only and does not form a recommendation to invest or otherwise. The value of an investment may fall. The investments referred to in this article may not be suitable for all investors, and if in doubt, an investor should seek advice from a qualified investment adviser.
These articles are provided for information purposes only. Occasionally, an opinion about whether to buy or sell a specific investment may be provided by third parties. The content is not intended to be a personal recommendation to buy or sell any financial instrument or product, or to adopt any investment strategy as it is not provided based on an assessment of your investing knowledge and experience, your financial situation or your investment objectives. The value of your investments, and the income derived from them, may go down as well as up. You may not get back all the money that you invest. The investments referred to in this article may not be suitable for all investors, and if in doubt, an investor should seek advice from a qualified investment adviser.
Full performance can be found on the company or index summary page on the interactive investor website. Simply click on the company's or index name highlighted in the article.
Disclosure
We use a combination of fundamental and technical analysis in forming our view as to the valuation and prospects of an investment. Where relevant we have set out those particular matters we think are important in the above article, but further detail can be found here.
Please note that our article on this investment should not be considered to be a regular publication.
Details of all recommendations issued by ii during the previous 12-month period can be found here.
ii adheres to a strict code of conduct. Contributors may hold shares or have other interests in companies included in these portfolios, which could create a conflict of interests. Contributors intending to write about any financial instruments in which they have an interest are required to disclose such interest to ii and in the article itself. ii will at all times consider whether such interest impairs the objectivity of the recommendation.
In addition, individuals involved in the production of investment articles are subject to a personal account dealing restriction, which prevents them from placing a transaction in the specified instrument(s) for a period before and for five working days after such publication. This is to avoid personal interests conflicting with the interests of the recipients of those investment articles.
Editor's Picks