Chart of the week: Will this tech trade deliver again?
25th June 2018 14:11

Is Tesla coiling into a big swoon?
I last covered this in my 'Chart of the week' of 3 April and pinpointed a successful short trade. But because this is a heavily shorted share, I am always on the lookout for temporary sharp rallies as nervous shorts are squeezed out of their positions.
Despite the lack of earnings and continued misses on production targets, hopes are being kept alive partly by Musk's star charisma and the seemingly unstoppable momentum of the electric vehicle (EV) revolution.
• Chart of the week: A short ride with Tesla shares
But slightly under the surface, the alternative – and much, much cleaner and greener hydrogen fuel cell technology - is making giant strides. Could EVs lose out to hydrogen and, of course, devastate Tesla Inc's share price?
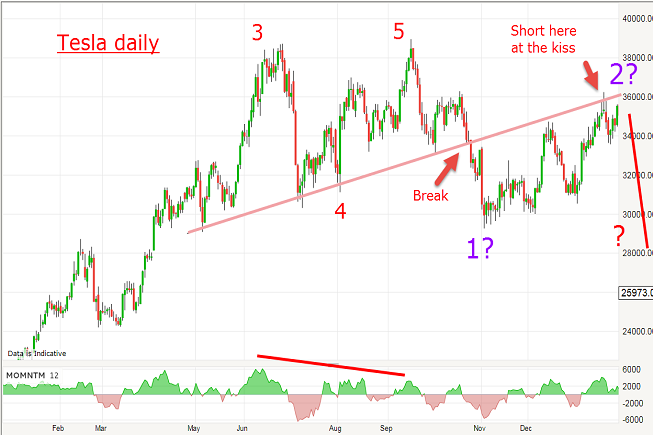
Back to 3 April – I had a short trade working using this chart:
Source: interactive investor Past performance is not a guide to future performance
My pink trendline was a solid line of support until the break - and now resistance - and when the market rallied to kissed it in February, that was my signal to enter a low-risk short trade at the $360 area.
It was low risk because I could set my protective buy stop just above the line, figuring any break above it would cancel out my immediately bearish scenario.
In fact, this is one of the major benefits of searching for these reliable trendlines – they allow the placing of a definite stop loss in case of error – little guesswork is involved, as is usually the case.
And right on cue and true to my roadmap, after that trade the market bounced heavily off the kiss in what I call a Scalded Cat Bounce – named in honour of the famous Dead Cat Bounce of bear market fame.
I have noted that when you have a genuine kiss on a long-standing line of support/resistance, the move away from it is likely to be explosive – and so it proved here.
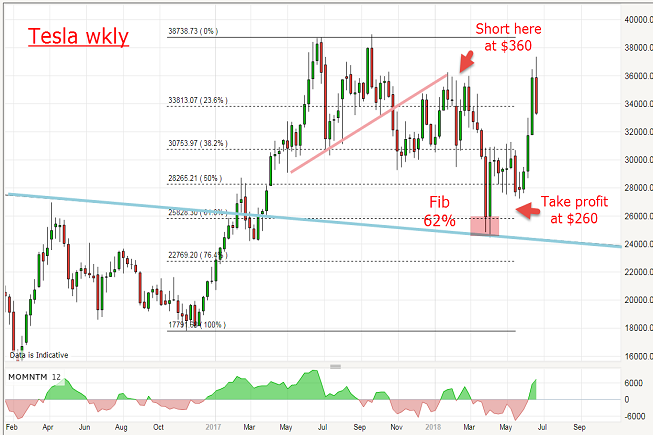
Here is the updated chart on the weekly:
Source: interactive investor Past performance is not a guide to future performance
My original target was the $220 area but, since then, I amended this likely downside target after applying my Fibonacci levels, and also slightly moving my blue tramline to better fit the existing highs/lows.
My new target became the $260 area, and that was duly achieved in April where I took profits of $100 per share. Not a bad return for a two-month trade.
And from that target, the market staged a strong recovery (in a short squeeze, perhaps?) and last week was back up to the $370 area to almost a new all-time high. That was no time to be short! And a justification of my approach to trade this share with great flexibility. This is no time to be too dogmatic.
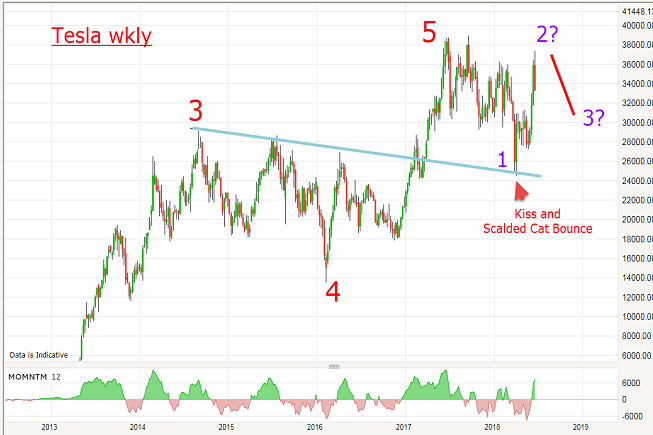
Here is my best guess for the upcoming moves:
Source: interactive investor Past performance is not a guide to future performance
The rally off the kiss is wave 2 of what should be a large five-wave pattern down and the decline off it is a third wave, but I need to see a strong move lower to validate this scenario.
Any move to new highs above $380 would likely delay any major move lower in the near term. But my major first objective is back to the wave 1 low at the $260 area. Breaking that would set up lower objectives.
John Burford is the author of the definitive text on his trading method, Tramline Trading.
These articles are provided for information purposes only. Occasionally, an opinion about whether to buy or sell a specific investment may be provided by third parties. The content is not intended to be a personal recommendation to buy or sell any financial instrument or product, or to adopt any investment strategy as it is not provided based on an assessment of your investing knowledge and experience, your financial situation or your investment objectives. The value of your investments, and the income derived from them, may go down as well as up. You may not get back all the money that you invest. The investments referred to in this article may not be suitable for all investors, and if in doubt, an investor should seek advice from a qualified investment adviser.
Full performance can be found on the company or index summary page on the interactive investor website. Simply click on the company's or index name highlighted in the article.
Disclosure
We use a combination of fundamental and technical analysis in forming our view as to the valuation and prospects of an investment. Where relevant we have set out those particular matters we think are important in the above article, but further detail can be found here.
Please note that our article on this investment should not be considered to be a regular publication.
Details of all recommendations issued by ii during the previous 12-month period can be found here.
ii adheres to a strict code of conduct. Contributors may hold shares or have other interests in companies included in these portfolios, which could create a conflict of interests. Contributors intending to write about any financial instruments in which they have an interest are required to disclose such interest to ii and in the article itself. ii will at all times consider whether such interest impairs the objectivity of the recommendation.
In addition, individuals involved in the production of investment articles are subject to a personal account dealing restriction, which prevents them from placing a transaction in the specified instrument(s) for a period before and for five working days after such publication. This is to avoid personal interests conflicting with the interests of the recipients of those investment articles.
Editor's Picks