Chart of the week: WPP shares in the 'buy zone'
16th April 2018 11:28
by John Burford from interactive investor
Share on
Time to put WPP into your wire shopping basket?
With Sorrell staging a well-publicised departure, is it time to take a look at the upside potential of Wire and Plastic Products? After all, the advertising giant's shares have been in a savage year-long bear trend that has taken them from the £19 area to the recent £11, and today they're down a lot on his departure.
And that is one reason why his leaving has not been greeted with overwhelming sadness. When shares are roaring northwards, very few complaints of the leadership are heard. But when sentiment turns sour, you can be sure that changes in a hurry!
There is no doubt that when a company founder 'retires' after over 30 years who has built a company into the biggest in its sector from nowhere, there is usually a psychological shift in the share market of some size.
And perhaps this will occur with . The negatives for the company are well rehearsed with the likes of and in the massive digital advertising sector a growing threat.
But sometimes, the market has already discounted the 'worst case scenario' that may never materialise. The charts can often give clues that this is the case. In any case, I can offer a possible trade that has low downside to my stop.
Here is the long-term monthly for perspective:
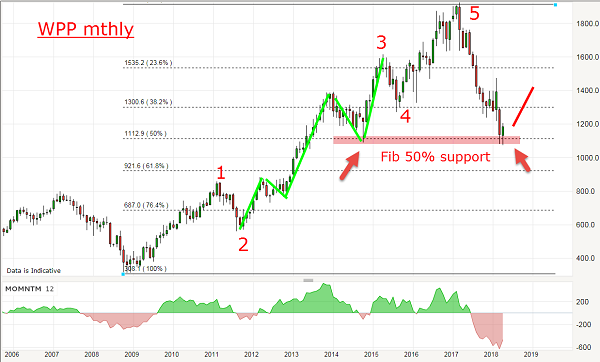
Source: interactive investor Past performance is not a guide to future performance
From the 2009 Credit Crunch low, I have a lovely five complete Elliott waves up to the £19 area with the third wave being the longest and strongest and containing its own five waves up. So far, so good.
And after a complete five-up comes a three-down, so the decline to the Fibonacci 50% support at £11 was reasonably expected - even last year when the slide got under way.
Here is the daily chart of the decline off the £19 high:
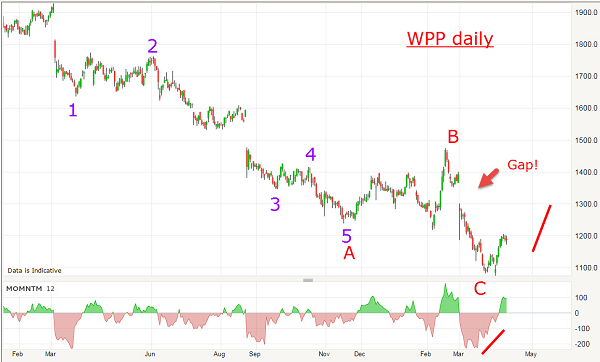
Source: interactive investor Past performance is not a guide to future performance
I have a three-down (marked A-B-C), with the A wave sporting a complete five-down, as is required. The other major feature is the huge momentum divergence at the recent low. This signals a likely rally phase ahead.
So now I have bullish reversal signals from both the monthly and daily charts.
There are three major gaps on the way down. There is a Gap Rule stating that gaps tend to get filled. They seem to act like magnets. It may take some time, but that is the rule.
Here is a close-up of the C wave off the B wave high:
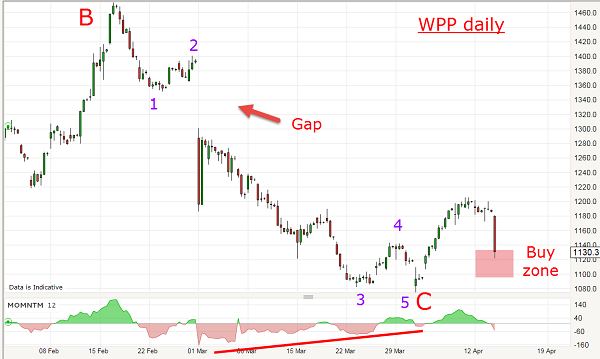
Source: interactive investor Past performance is not a guide to future performance
The C wave sports a five-down, which is also required and the wave 5/C wave low occurs on a very strong momentum divergence. This is another clue that a rally phase likely lies ahead.
And with today's sharp sell-off, the shares have come down into my buying range where a low risk trade can be entered using a stop loss below the £10.75 low.
And if this works out, I can see a rally to close the gap in the £13 - £13.50 area with higher potential. I believe the short interest is substantial, and a short squeeze is possible once a selling climax exhausts.
These articles are provided for information purposes only. Occasionally, an opinion about whether to buy or sell a specific investment may be provided by third parties. The content is not intended to be a personal recommendation to buy or sell any financial instrument or product, or to adopt any investment strategy as it is not provided based on an assessment of your investing knowledge and experience, your financial situation or your investment objectives. The value of your investments, and the income derived from them, may go down as well as up. You may not get back all the money that you invest. The investments referred to in this article may not be suitable for all investors, and if in doubt, an investor should seek advice from a qualified investment adviser.
Full performance can be found on the company or index summary page on the interactive investor website. Simply click on the company's or index name highlighted in the article.
Disclosure
We use a combination of fundamental and technical analysis in forming our view as to the valuation and prospects of an investment. Where relevant we have set out those particular matters we think are important in the above article, but further detail can be found here.
Please note that our article on this investment should not be considered to be a regular publication.
Details of all recommendations issued by ii during the previous 12-month period can be found here.
ii adheres to a strict code of conduct. Contributors may hold shares or have other interests in companies included in these portfolios, which could create a conflict of interests. Contributors intending to write about any financial instruments in which they have an interest are required to disclose such interest to ii and in the article itself. ii will at all times consider whether such interest impairs the objectivity of the recommendation.
In addition, individuals involved in the production of investment articles are subject to a personal account dealing restriction, which prevents them from placing a transaction in the specified instrument(s) for a period before and for five working days after such publication. This is to avoid personal interests conflicting with the interests of the recipients of those investment articles.