Where next for FTSE 100 and gold?
Our chartist looks at the FTSE's illogical movements and gold's performance. Here's what the numbers say.
7th August 2020 09:35
by Alistair Strang from Trends and Targets
Share on
Our chartist looks at the FTSE's illogical movements and gold's performance. Here's what the numbers say.

FTSE for Friday & gold again!
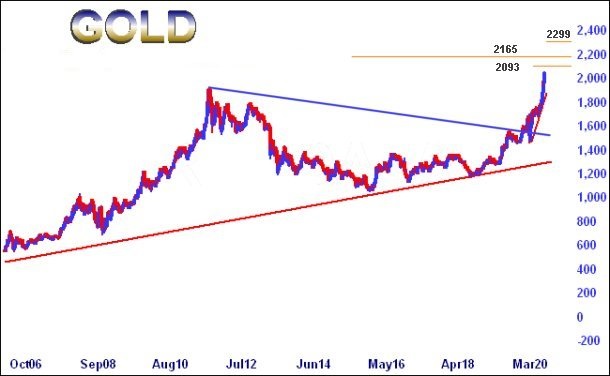
Gold's behaving like a ramped AIM stock. When we gave our (astoundingly accurate) gold prediction on 24th June, we anticipated some hesitation around the $2,055 (£1,569) level.
We did not expect the hesitation to last for just 22 hours and only provoke a $25 reversal before climbing. But that's what happened, with the precious metal again hitting another all-time high on 6 August.
So what's next, given gold has managed to exceed our $2,055 level?
Is the metal about to leap upward to $3,000, as some analysts are predicting?
We are forced to be a little optimistic now, as above $2,070 now looks capable of a further rise to $2,093.
If bettered, secondary calculates at $2,165, but overall we're forced to admit $2,299 works out as the next major point of interest, a price level where ‘normal rules’ again mandate some volatility should be expected.
If it all goes wrong, the earliest warning signal looks like the yellow stuff trading below $2,028, as this allows reversal to an immediate $2,016 with secondary, when broken, calculating at $1,995.
If this happens it could also tumble to $,1956 with painful speed as the price attempts to mimic what happens to over-enthusiastic AIM shares.
For the present, the big picture is quite serious, suggesting the $2,300 level should be treated with respect. It's a ‘higher high’ thing!
Source: Trends and Targets Past performance is not a guide to future performance
FTSE (FTSE:UKX) for Friday
Another weekend, another Grand Prix.
Hopefully less boring than last week’s insipid Silverstone, a race which stored all the excitement until the final lap, when Louis Hamilton proved why he's world champion!
The climactic ending, unfortunately, did follow the script for the children’s film‘Cars’!
Also following a script is the UK stock market.
Unfortunately, it is possible the script is in a language no-one can read as the market is producing some incredibly illogical movements presently.
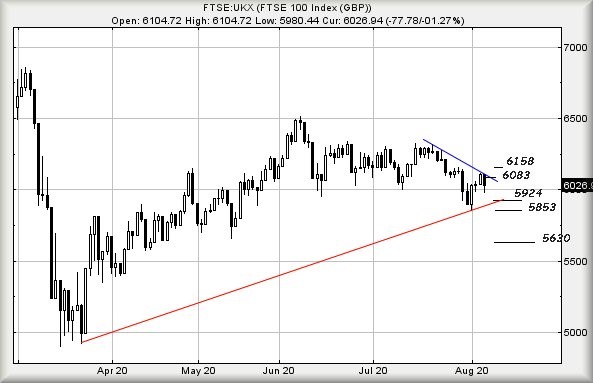
The low this week of 5,856 points actually did make a lot of sense but what has occurred since is rather confusing.
Near-term, if the index makes it below 5,980 points, we are calculating a visit to 5,924 is expected with secondary, if broken, at 5,853 points.
This secondary is troublesome, slightly below Monday’s dip and presenting the risk of negative news driving the UK index down to 5,630 or lower.
Visually, the tightest stop is at 6,080 points.
The other side of the coin speculates what is possible should the FTSE manage to claw its way above 6,045 points.
Apparently we can calculate an initial ambition at 6,083 points with secondary, if exceeded, up at 6,158 points.
If triggered, the tightest stop looks like 5,978 points.
Have a good weekend.
Source: Trends and Targets Past performance is not a guide to future performance
Alistair Strang has led high-profile and "top secret" software projects since the late 1970s and won the original John Logie Baird Award for inventors and innovators. After the financial crash, he wanted to know "how it worked" with a view to mimicking existing trading formulas and predicting what was coming next. His results speak for themselves as he continually refines the methodology.
Alistair Strang is a freelance contributor and not a direct employee of Interactive Investor. All correspondence is with Alistair Strang, who for these purposes is deemed a third-party supplier. Buying, selling and investing in shares is not without risk. Market and company movement will affect your performance and you may get back less than you invest. Neither Alistair Strang or Interactive Investor will be responsible for any losses that may be incurred as a result of following a trading idea.
These articles are provided for information purposes only. Occasionally, an opinion about whether to buy or sell a specific investment may be provided by third parties. The content is not intended to be a personal recommendation to buy or sell any financial instrument or product, or to adopt any investment strategy as it is not provided based on an assessment of your investing knowledge and experience, your financial situation or your investment objectives. The value of your investments, and the income derived from them, may go down as well as up. You may not get back all the money that you invest. The investments referred to in this article may not be suitable for all investors, and if in doubt, an investor should seek advice from a qualified investment adviser.
Full performance can be found on the company or index summary page on the interactive investor website. Simply click on the company's or index name highlighted in the article.