Stockwatch: an energy stock for better portfolio balance
This FTSE 100 company has been on an impressive uptrend since the Covid crash and analysts at two big City banks rate the shares highly. Analyst Edmond Jackson shares his opinion.
30th April 2024 12:21
by Edmond Jackson from interactive investor

Following on from Barclays (LSE:BARC) and NatWest Group (LSE:NWG) in my last article, it is interesting to consider integrated energy group Centrica (LSE:CNA) as regards out-of-favour, modestly rated situations.
“Integrated” means supply besides sourcing, also referred to as downstream and upstream respectively. One key reason Centrica blipped on my radar this week was while reading research arguing that energy-related exposure in a portfolio can achieve a better long-term defensive aspect than bonds. This was also questioning the classic 60:40 portfolio split of equities and bonds in pursuit of risk-adjusted return.
- Invest with ii: Open a Stocks & Shares ISA | ISA Investment Ideas | Transfer a Stocks & Shares ISA
Barclays and NatWest are currently off to the races, but only as recently as February they languished on low price/earnings (PE) multiples and high yields; a classic “mean-reversion” is now under way as high-profile financial stocks lead the way.
Not to imply similar potential dynamism at Centricam but it’s interesting to note how relatively weak sentiment has been lately towards it.
My instinct towards this stock is more as a portfolio hedge should sentiment turn adversely. Much of the current market optimism relates to interest rate reduction hopes and resilient consumer spending (helped by high asset prices). Meanwhile, geopolitical risks such as Russia/Ukraine and the Middle East continue to smoulder.
Since last September, Centrica has been in a downtrend from its 160-170p spike, which went against the “everything rally” as investors piled into risk assets. This was triggered by the US Federal Reserve changing its narrative on interest rates, encouraging speculation that washed over here. The stock appeared to find support at around 124p after the tax year-end, although has weakened again just lately, slipping below 130p this morning.
Mind, in a five-year context, this effectively constitutes mean-reversion to an uptrend since the March 2020 Covid low:
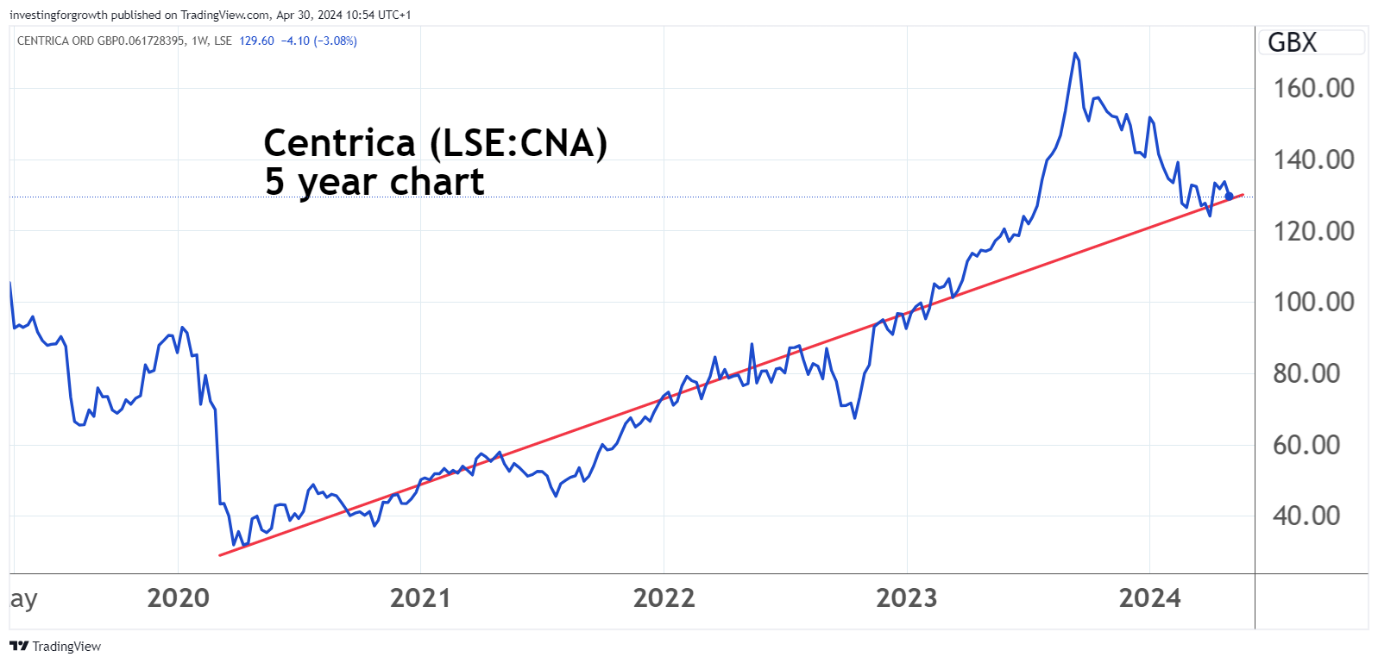
Source: TradingView. Past performance is not a guide to future performance.
US perspectives are more positive than UK sentiment
Last February, JP Morgan asserted an “overweight” stance at 133p, and this month Goldman Sachs edged up its share price target to 195p from 190p – implying nearly 50% capital upside from the current market price.
This is in context also of GMO Asset Management’s asset allocation team declaring in its 21 March insights: “Record market highs...but we’re still excited. An abundance of cheap assets underpins this enthusiasm from an absolute return standpoint, while appealing valuation spreads within asset classes present us with the best relative asset allocation opportunity we’ve seen in 35 years.”
I do not know if GMO holds Centrica, but the stock does qualify generally on all 11 counts for a “growth at reasonable price” quantitative screen.
Morgan’s bullish stance came in context of a decline of over 20% from highs around 170p last September, with the price falling 8% in the first seven weeks of 2024. The stock had sold off after a fall in commodity prices triggered earnings downgrades. Indeed, consensus anticipates normalised earnings per share (EPS) progressively to halve below 15p in respect of 2025, implying a forward PE below nine times.
- Insider: boardroom buyer backs this FTSE 100 top pick
- Shares for the future: my third-favourite stock to own
Furthermore, Morgan argued, a 133p share price (February) implied an earnings outcome some 25% below guidance and the company would destroy over £1 billion in value from capital expenditure and investments. The bank saw Centrica as well-positioned to meet its targets without needing higher commodity prices. It envisaged 43% upside even assuming no value creation from the company’s growth investments.
It also argued a £1 billion share buyback programme under way means a potential catalyst for a re-rating. Well, that has yet to show it can, and I would prefer boards paid out more as dividends than made it easier for executives to achieve per share targets.
Other valuation essentials and outlook are less exciting
With the stock currently weakening again, its prospective dividend yield is 4.3% in respect of 2025, for which consensus (probably guided) expects a 5.6p payout covered 2.6x by expected earnings. Frankly, you can find better elsewhere, probably why income investors are yet to buy Centrica’s drop.
The stock also trades on 2.2x tangible net asset value or 1.8x regular net asset value (NAV).
Investors are left scrolling the narrative for much hope, where February’s outlook statement was rather hesitant, cautioning: “…a range of factors that could impact financial performance” – weather, commodity prices, the economy and regulatory backdrop.
Considering this 10-year table I have put together below, Centrica is relatively more variable than Shell (LSE:SHEL), for example, at least in recent years. Operating margins are weak and volatile – likely a function of competitive energy supply versus Shell generally in high single digits at least. So, if it is true how having an energy component in an investment portfolio offers better defensiveness than bonds, it could make sense to have exposure to Shell and BP (LSE:BP.) than rely on Centrica.
Centrica - financial summary
Year ended 31 Dec
| 2013 | 2014 | 2015 | 2016 | 2017 | 2018 | 2019 | 2020 | 2021 | 2022 | 2023 | |
| Turnover (£ million) | 26,571 | 29,408 | 27,971 | 27,102 | 28,023 | 27,381 | 15,958 | 14,949 | 18,300 | 33,637 | 33,374 |
| Operating margin (%) | 10.6 | 1.8 | 4.7 | 9.1 | 1.7 | 3.1 | -4.9 | -2.4 | 5.2 | -0.7 | 19.5 |
| Operating profit (£m) | 2,518 | -1,137 | -857 | 2,486 | 486 | 848 | -783 | -362 | 954 | -240 | 6,512 |
| Net profit (£m) | 1,333 | -1,005 | -884 | 1,662 | 303 | 183 | -1,023 | 41.0 | 1,210 | -782 | 3,929 |
| Reported earnings/share (p) | 18.3 | -20.2 | -14.9 | 31.2 | 6.0 | 3.3 | -16.7 | -4.7 | 10.0 | -13.3 | 70.6 |
| Normalised earnings/share (p) | 37.6 | 16.0 | 28.8 | 31.3 | 12.6 | 15.2 | 10.4 | 12.0 | 14.2 | 60.7 | 32.3 |
| Operating cash flow/share (p) | 56.6 | 21.8 | 42.0 | 45.1 | 34.5 | 34.4 | 21.7 | 24.0 | 27.6 | 22.4 | 49.4 |
| Capital expenditure/share (p) | 31.0 | 28.7 | 19.2 | 15.3 | -0.6 | 16.5 | 13.6 | 8.4 | 7.2 | 6.3 | 6.0 |
| Free cash flow/share (p) | 25.6 | -6.9 | 22.8 | 29.8 | 33.9 | 17.9 | 8.2 | 15.6 | 20.4 | 16.1 | 43.4 |
| Dividend per share (p) | 16.7 | 17.2 | 12.0 | 12.0 | 12.0 | 12.0 | 1.5 | 0.0 | 1.0 | 3.3 | 2.7 |
| Covered by earnings (x) | 2.3 | 0.9 | 2.4 | 2.6 | 1.1 | 0.3 | -11.2 | 0.0 | 10.0 | -4.0 | 26.4 |
| Net debt (£m) | 5,312 | 6,365 | 5,698 | 4,492 | 3,434 | 3,522 | 3,969 | 3,621 | -50.0 | -325 | -2,694 |
| Net assets (£m) | 5,257 | 3,071 | 1,342 | 2,844 | 3,428 | 3,145 | 1,212 | 957 | 2,365 | 1,017 | 3,877 |
| Net assets per share (p) | 98.7 | 57.6 | 25.2 | 53.4 | 64.3 | 55.2 | 20.8 | 16.4 | 40.2 | 17.3 | 71.6 |
Source: historic company REFS and company accounts.
Why shareholders should push for higher payouts
I am more impressed that this £7 billion company published its numbers and narrative just six weeks after 31 December.
Due to the disposal of Spirit Energy, Norway, there was differential in adjusted versus statutory numbers: adjusted operating profit down 17% to £2,752 million and earnings per share 4% easier at 33.4p. Free cash flow was 11% down at £2,207 million. At the headline level, however, there was a £6,512 million operating profit, which generated EPS of 70.6p. Net cash jumped 129% to £2,744 million although the dividend crept up only from 3.0p to 4.0p (costing £213 million as the payout completes).
Doubtless the board would say its buyback programme helps enhance the dividend, but relatively less that the payout itself, I think. This is not a stock poised to re-rate if the market reckons the yield is priced too generously for Centrica’s risks. It is also less competitive than BP 4.7% and similar to Shell at 4.0%.
- 10 hottest ISA shares, funds and trusts: week ended 26 April 2024
- Making the most of your tax breaks in 2024
The 2023 group cash flow statement showed very low – only £115 million – net investment, given around £370 million was substantially offset by joint venture dividends and interest. Only £186 million went out as group dividends – up on £59 million in 2022, yet small relative to £613 million dwarfed on share buybacks in 2023.
At year-end Centrica had £4.1 billion of debt, chiefly long term, massively offset by £6.4 billion cash. This still meant a £39 million net finance cost, but I would say shareholders here should be pushing for higher payouts.
Projections look set to remain tricky
Management guides for around £800 million sustainable adjusted annual operating profit from energy supply: constituted £150 million to £250 million by British Gas services and solutions, £250 million to £350 million by Centrica Energy, and UK business energy supply £100 million to £200 million. Such substantial ranges relate to uncertainty over energy pricing.
Then there is the “upstream” infrastructure side consisting of UK gas, nuclear and energy storage activities. These achieved a £1,083 million operating profit last year, a 40% fall, and unlike the downstream side there was no guidance – for what that is worth – making projections rather awkward.
- How the pros are preparing portfolios for interest rate cuts
- eyeQ: why Legal & General shares could be vulnerable
In terms of initial assessment of Centrica, I therefore find it quite an act of faith to share the optimism of JP Morgan and Goldman Sachs. Better substantiation by way of numbers is needed, with a materially higher dividend payment I would concur.
Given that I am sceptical that Nato will prevail versus Russia over Ukraine, and am also wary of the Middle East, I still regard energy-related shares as a priority to assess. Energy prices could get squeezed higher again and Centrica’s chart is back to its uptrend level. Hold.
Edmond Jackson is a freelance contributor and not a direct employee of interactive investor.
These articles are provided for information purposes only. Occasionally, an opinion about whether to buy or sell a specific investment may be provided by third parties. The content is not intended to be a personal recommendation to buy or sell any financial instrument or product, or to adopt any investment strategy as it is not provided based on an assessment of your investing knowledge and experience, your financial situation or your investment objectives. The value of your investments, and the income derived from them, may go down as well as up. You may not get back all the money that you invest. The investments referred to in this article may not be suitable for all investors, and if in doubt, an investor should seek advice from a qualified investment adviser.
Full performance can be found on the company or index summary page on the interactive investor website. Simply click on the company's or index name highlighted in the article.
Disclosure
We use a combination of fundamental and technical analysis in forming our view as to the valuation and prospects of an investment. Where relevant we have set out those particular matters we think are important in the above article, but further detail can be found here.
Please note that our article on this investment should not be considered to be a regular publication.
Details of all recommendations issued by ii during the previous 12-month period can be found here.
ii adheres to a strict code of conduct. Contributors may hold shares or have other interests in companies included in these portfolios, which could create a conflict of interests. Contributors intending to write about any financial instruments in which they have an interest are required to disclose such interest to ii and in the article itself. ii will at all times consider whether such interest impairs the objectivity of the recommendation.
In addition, individuals involved in the production of investment articles are subject to a personal account dealing restriction, which prevents them from placing a transaction in the specified instrument(s) for a period before and for five working days after such publication. This is to avoid personal interests conflicting with the interests of the recipients of those investment articles.