Winners and losers among my trust tips over the past year
24th July 2023 09:32
by Andrew Pitts from interactive investor
Andrew Pitts runs through how the portfolios have fared, including three headwinds that held back performance.

Andrew Pitts’s trust tips were first introduced by Money Observer more than 20 years ago. Their performance began to be monitored as portfolios in August 2014. In July 2020, Andrew took over monitoring the portfolios. The trust tips are made by Andrew and not interactive investor. There is an editorial update of the portfolios every quarter, and the annual review takes place each July.
A lengthy period of high and rising interest rates to tackle entrenched inflation, coupled with weak prospects for global economic growth, is not a happy hunting ground for investors to make decent gains. The impact has been particularly pronounced for investment trusts and arguably more so for most constituents of the conservative and adventurous investment trust portfolios.
- Invest with ii: Top Investment Trusts | ii Super 60 Investments | Open a Trading Account
That’s due to several factors. First, a change in sentiment over the past few years has seen many investment trust share prices fall to historically wide discounts compared with their underlying net asset value (NAV). In the ‘glory days’ that persisted for more than a decade from 2009, discounts in general steadily narrowed and many trusts traded on large premiums to NAV for many years. Very few do so today.
According to the Association of Investment Companies (AIC), the average discount on trusts reached 14% by 30 June, up from just over 12% at the start of the year. Richard Stone, chief executive of the industry’s trade body, says: “Investor sentiment has created a challenging backdrop for fundraising and driven discounts to unusually wide levels. Historically, times like these have often proven to be good times to buy, but we may see more volatility during the rest of 2023, especially if inflation remains high and interest rates continue to climb.”
Second, the relative strength of sterling against major currencies has also depressed returns from trusts with assets in overseas markets, and both portfolios are heavily invested beyond the UK’s shores. Sterling has gained about 9% against the dollar over 12 months, for example, and more that 10% against the yen. Against the euro, however, sterling has been flat over the year.
The third element holding back performance is that both portfolios generally pursue growth-focused (as opposed to value) investment themes, particularly the adventurous version. A neat way to express this is in their risk profiles. Data analysis firm FE produces an FE Risk Score for the benchmark FTSE All-Share index, which is expressed as 100. The adventurous portfolio has a risk score of 132 but the conservative portfolio’s FE Risk Score is much lower, at 103, with volatility also lower than the adventurous version.
- Where to invest in Q3 2023? Four experts have their say
- DIY Investor Diary: how I apply Warren Buffett tips to fund investing
- Funds and trusts four professionals are buying and selling: Q3 2023
Each portfolio is comprised of 10 investment trusts that are equally weighted between various investment strategies and regions. Investors should be aware that this is not intended to represent an optimum asset allocation: publicly listed and private equity represent more than 90% of assets in both portfolios. Investors might also prefer to have differing allocations to these regions and strategies.
The two portfolios include exposure to asset classes – both directly and indirectly – that are difficult for open-ended investment companies (Oeics) and unit trusts to access. These include private equity (companies that are not listed on public stock markets), infrastructure assets and physical property. However, these asset classes are generally performing poorly in the current environment.
You can view the 20 investment trusts in the two portfolios here.
Trust portfolios make a decent recovery over the year
| % total return after: | Return since | |||||
| 3 mths | 6 mths | 1 yr | 3 yrs | 5 yrs | Aug '14 | |
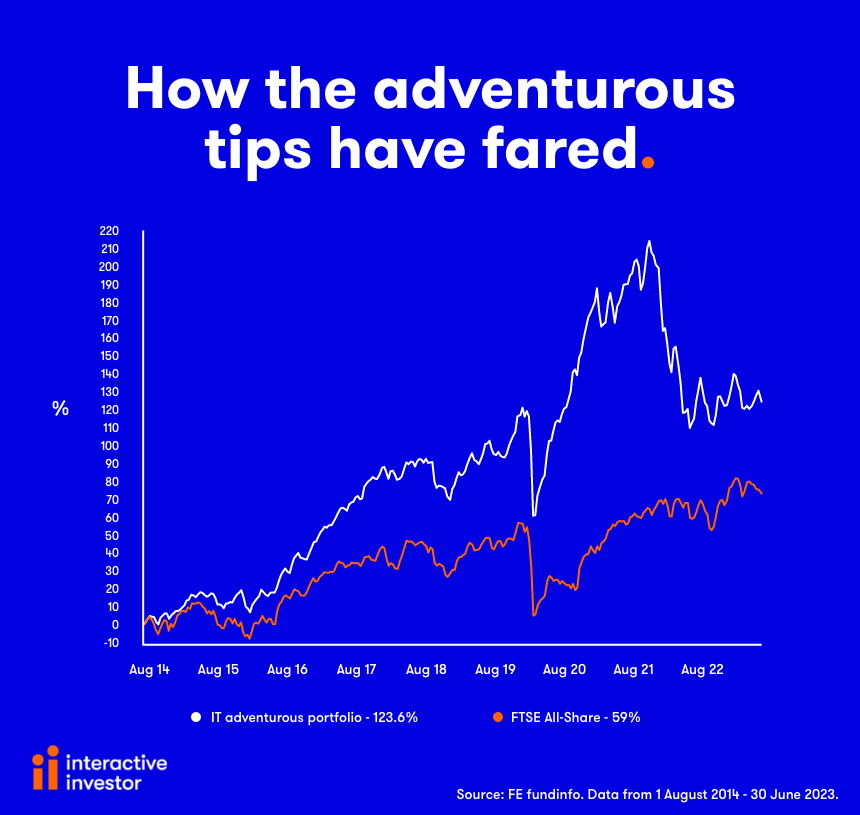
| Adventurous portfolio | 1.5 | 1.0 | 6.8 | 8.4 | 18.6 | 123.6 |
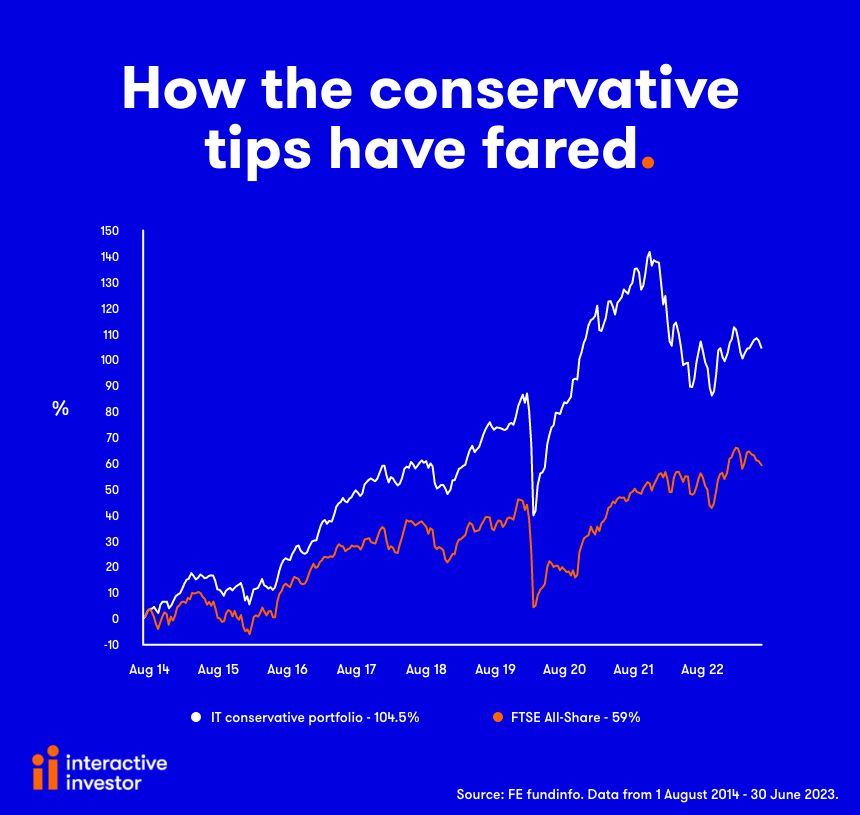
| Conservative portfolio | 0.6 | 1.9 | 8.4 | 17.9 | 29.5 | 104.5 |
| Benchmark indices | ||||||
| FTSE All-Share index | -0.5 | 2.6 | 7.9 | 33.2 | 16.5 | 59.0 |
| FTSE All World index | 3.2 | 7.5 | 11.1 | 32.8 | 52.9 | 153.4 |
Notes: Performance of the portfolios as at 30 June 2023, before deduction of underlying trading charges. Data source: FE Analytics. Past performance is not a guide to future performance.
Clawing back lost ground
Both portfolios include investment trusts that have made decent returns over the year to 30 June, but they are not doing as well as in the past. In last year’s annual review, and in subsequent quarterly updates, I warned that this was likely to be the case should interest rates and inflation continue to be elevated.
However, as expected, the conservative portfolio’s 8.4% annual gain has bettered the adventurous option, which is up 6.8%. That goes some way to make up for the steep losses in the year to 30 June 2022, when the portfolios were down -16.2% and -26.9% respectively.
The index benchmarks we use to compare performance – the FTSE All-Share and FTSE All-World indices – gained 7.9% and 11.1% respectively over the year, with the latter particularly strong over the past six months due to its high weighting to the US stock market, which has performed very well.
The adventurous portfolio benefited from the investment buzz over generative AI: its specialist choice, Allianz Technology Trust (LSE:ATT), gained an impressive 26% over the year. European trusts have also done well, and Montanaro European Smaller Companies (LSE:MTE) bucked the general shunning of global small-caps with a 16.8% gain. Similarly, emerging markets choice Mobius Investment Trust (LSE:MMIT) was up 12.2%.
First-quartile gains in their respective sectors over 12 months were recorded by UK smaller companies specialist BlackRock Throgmorton Trust (LSE:THRG), up 7.4%, and Dunedin Income Growth (LSE:DIG), with shares in the UK equity income specialist up a decent 8.4%.
This portfolio includes four investment trusts managed by Baillie Gifford. Last year’s addition of Pacific Horizon (LSE:PHI) is proving to be the biggest drag, with the shares down -11.4%. Japanese smaller companies specialist Baillie Gifford Shin Nippon (LSE:BGS) lost -0.9%, while Baillie Gifford US Growth (LSE:USA) also disappointed, with the shares up just 2.8% (although there has been some improvement in the past few months). The global trust Monks (LSE:MNKS) returned 6.8%. Baillie Gifford US Growth is being replaced in this review, I explain why here.
Past performance is not a guide to future performance.
Best in show for the conservative portfolio was Henderson EuroTrust (LSE:HNE), which justified faith in its retention with a gain of 24%. Finsbury Growth & Income (LSE:FGT) also returned to form, up 18%, and JPMorgan American (LSE:JAM) did well to record a 13.9% uplift. Schroder Asian Total Return (LSE:ATR) returned just 3.8%, but this was among the best in the region.
Trusts in the conservative portfolio that have failed to shine in the past year include global choice Bankers (LSE:BNKR), up just 1.5%; last year’s addition of Fidelity Special Values (LSE:FSV), which has gained 1.7%; and JPMorgan Emerging Markets (LSE:JMG), up 0.8%. The biggest surprise came from Capital Gearing (LSE:CGT), down -7.7%, which is disappointing for a trust that aims to preserve capital. JPMorgan Japanese is being replaced, which I cover separately here.
Past performance is not a guide to future performance.
Although the medium-term performance of both portfolios has been disappointing, with both underperforming the benchmark indices over the past three years, and a more mixed performance after five years, the gains made since inception in August 2014 is far more encouraging. The conservative portfolio is up 104.5% and the adventurous option tops that with a 123.6% uplift. Despite recent disappointments those represent annualised gains of 11.6% and 13.7% respectively.
If anything, this shows the benefit of staying the course and not chucking in the towel when the outlook is gloomy. As an added incentive, the portfolios (as at end of June before proposed changes) could be bought on high average discounts to NAV of -12.4% for the adventurous option and -11.2% for the conservative choices.
Separately, I reveal my picks for the year ahead for the conservative and adventurous portfolios, and provide a performance breakdown for all constituents over various time periods.
Andrew Pitts was editor of Money Observer from 1998 to 2015.
Data sources: FE Analytics, AIC/Morningstar, company documents. All data refers to 30 June unless stated (some portfolio weightings quoted in the article are as at 31 May).
As part of a diversified portfolio, Andrew Pitts holds shares in Baillie Gifford Shin Nippon, Bankers, Capital Gearing, Dunedin Income Growth, Fidelity Special Values, JPMorgan Japanese, Mobius, Monks, Pacific Horizon and Schroder Asian Total Return.
These articles are provided for information purposes only. Occasionally, an opinion about whether to buy or sell a specific investment may be provided by third parties. The content is not intended to be a personal recommendation to buy or sell any financial instrument or product, or to adopt any investment strategy as it is not provided based on an assessment of your investing knowledge and experience, your financial situation or your investment objectives. The value of your investments, and the income derived from them, may go down as well as up. You may not get back all the money that you invest. The investments referred to in this article may not be suitable for all investors, and if in doubt, an investor should seek advice from a qualified investment adviser.
Full performance can be found on the company or index summary page on the interactive investor website. Simply click on the company's or index name highlighted in the article.