El Niño: when weather moves financial markets
How the climate phenomenon could shape frontier economies.
25th August 2026 09:38
by Leo Morawiecki from Aberdeen

Over the past few months, weather phenomenon El Niño has become a regular topic of discussion with clients. In truth, it’s been a welcome change from the constant focus on geopolitical volatility.
Here, we’ll focus more on the higher-yielding part of the emerging market (EM) universe, given the disproportionate impact that El Niño has on food and energy prices. Both items have a higher-than-average weight in the consumption basket among smaller EM issuers in comparison to broader EM and developed market peers (see Chart 1). Research shows the lower the GDP per capita, the higher the food weight in the consumption basket.
Why this is not 2022’s inflation shock
El Niño disrupts weather patterns, often bringing drier and hotter conditions to Southern Africa and parts of Asia, while causing heavier rainfall and flooding in parts of South America and East Africa. Meteorologists currently put the odds of El Niño developing between November 2026 and January 2027 at 88%. The upcoming event is being described as a super El Niño, which we admit sounds precarious.
The good news is that unlike earthquakes or hurricanes, El Niño develops gradually, giving governments time to prepare. And as long as the phenomenon doesn’t remain around forever (which it won’t), most of the economic effects should prove temporary.
Indeed, history shows that the trends of higher energy prices and inflation, as well as softer growth, usually reverse as weather conditions normalise and supply recovers.
This is not to dismiss the initial impact. Rather, it suggests El Niño is unlikely to trigger the prolonged inflationary shock and monetary tightening seen after Covid and the outbreak of the Russia-Ukraine war in 2022.
Instead, fiscal policy is more likely to act as the buffer, either through reconstruction spending or relief provided to affected farmers and low-income households, particularly across Latin America and Africa. A case in point is Ecuador.
(Chart 1): Expected El Niño impact across the globe 2026-27
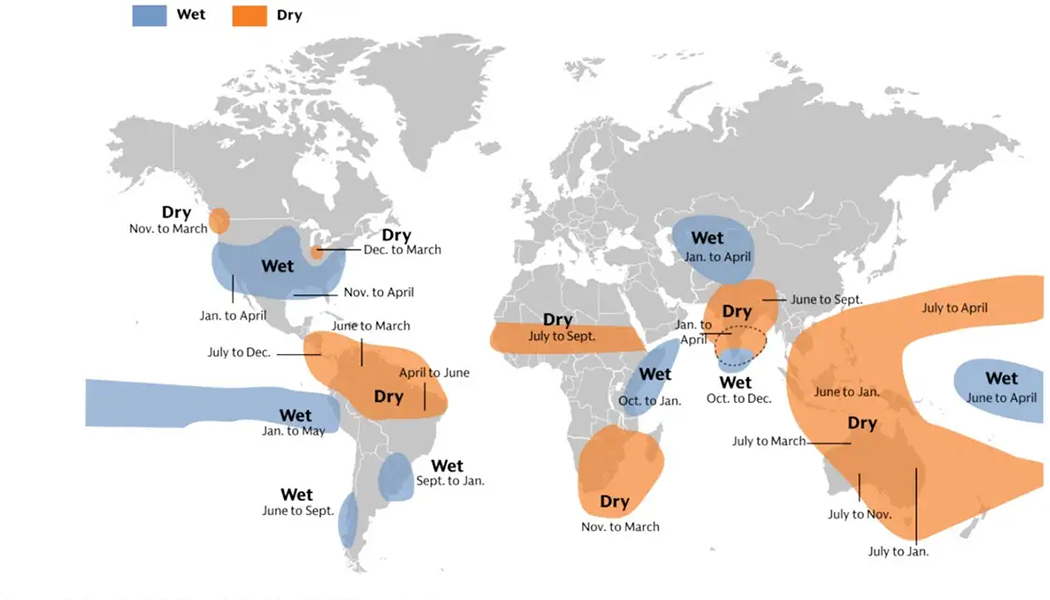
Source: International Research Institute for Climate and Society, Goldman Sachs Global Investment Research.
Ecuador
Ecuador is among Latin American’s most exposed countries to El Niño due to its location along the Pacific coast and the importance of agriculture, fisheries, and transport infrastructure to its economy. The 1997 El Niño resulted in a 15% hit to the economy, making it one of the costliest natural disasters in the country’s history.
Shrimp, Ecuador’s largest export, are vulnerable to higher water temperatures, lower water quality, and disease risks. In 2025, Ecuador exported $8.4 billion (£6.2 billion) worth of shrimp versus $7.8 billion worth of petroleum. If we assume 50% of shrimp farms are affected, losses could reach $1.6 billion or 1% of GDP under a strong El Niño, mainly owing to lower export volumes and reduced revenues.
Ecuador’s ministry of finance estimates that under these conditions, the fiscal deficit could widen by 1-2% of GDP, while inflation could rise by 1.5-3% in the fourth quarter of 2026 before normalising in 2027.
Another vulnerability is power. Ecuador relies heavily on hydropower, making electricity supply vulnerable to drought. The 2023-24 El Niño exposed this weakness through power shortages and a repeat would hit households and businesses directly. For President Daniel Noboa, more blackouts could quickly become a political problem as well as an economic one.
It is, however, important to highlight the fundamental position of Ecuador and the firepower at its disposal to withstand an external shock.
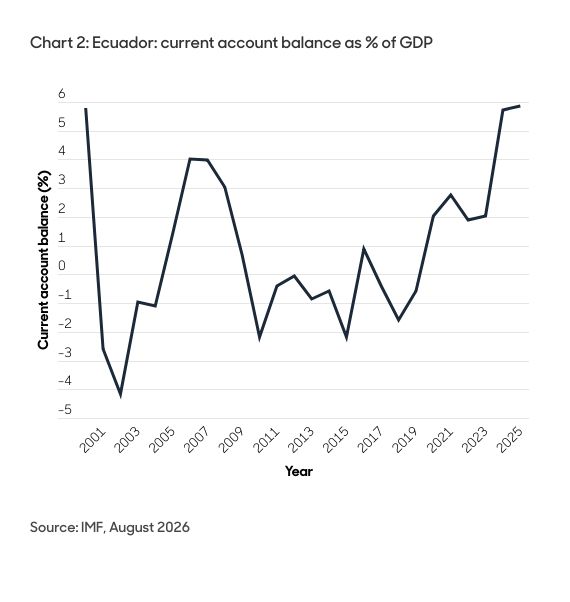
First, the current account balance has moved to a surplus, the largest recorded in over two decades (see Chart 2). This has largely been driven by an improvement in the terms of trade and, to a lesser extent, remittances. Ecuador is one of the few net oil exporters in Latin America.
Second, is the rise in foreign exchange reserves. At the end of 2025, reserves reached a record high of $12.5 billion, equivalent to over four months’ import cover. If the inflow of US dollars dries up (either due to lower exports or a slowdown in remittances), this large reserve buffer would enable Ecuador to cover financing needs or service external debt.
A rise in cocoa prices is all but inevitable
Cocoa is the commodity most exposed to El Niño and Ivory Coast is the world’s top producer. Ecuador recently overtook Ghana to claim second place (see below table).
Chart 3: Cocoa production (million tonnes)
| Years | 23/24 | 24/25 | 25/26 | 26/27 |
| Ivory Coast | 1.67 | 1.7 | 1.85 | 1.85 |
| Ghana | 0.48 | 0.63 | 0.58 | 0.55 |
| Ecuador | 0.43 | 0.55 | 0.62 | 0.6 |
| Nigeria | 0.32 | 0.36 | 0.35 | 0.36 |
| Cameroon | 0.32 | 0.31 | 0.24 | 0.25 |
| Indonesia | 0.21 | 0.19 | 0.19 | 0.2 |
| Brazil | 0.2 | 0.2 | 0.24 | 0.22 |
| Peru | 0.18 | 0.19 | 0.19 | 0.2 |
| Rest of World | 0.62 | 0.7 | 0.63 | 0.62 |
| Global Production | 4.41 | 4.82 | 4.88 | 4.84 |
Source: World Bank August 2026.
During previous El Niños, cocoa prices gained 19% in 1997-98, 23% in 2002-03, 24% in 2009-10, 9% in 2015-16, and 56% in 2023-24. Over the next 18 months, disease pressure and weak investment will weigh on cocoa production, but the single-largest risk factor to production is the Harmattan. This is a seasonal dry wind that blows from the Sahara, bringing low humidity and reduced rainfall across West Africa.
During the 2016 El Niño, Harmattan conditions contributed to a fall in the Ivory Coast’s cocoa production from around 1.8 million tonnes to 1.5 million, a 16% drop. Cocoa accounts for more than 50% of its export earnings and around 15% of GDP, so the main macro impact came through the external accounts. Despite cocoa prices rising by over 50%, export volumes fell and its current account deficit widened from 1.7% of GDP in 2015 to 3.0% in 2016.
However, the 2016 episode also highlights why the economic impact on the Ivory Coast should remain manageable. Unlike Ecuador, the transmission channel is narrower and concentrated in one export crop rather than widespread damage across infrastructure, fisheries and transport networks.
Higher cocoa prices provide a partial offset to lower production volumes. In recent years, the country’s Coffee and Cocoa Council (CCC) has reduced the share of cocoa sold forward, allowing external accounts to follow more closely the rise in spot prices. Therefore, while a weaker cocoa harvest will widen the current account deficit, the fiscal and external impact should be cushioned by higher spot-price participation.
Final thoughts…
The lesson from El Niño is that the weather rarely tells the whole story.
Two countries may face the same climatic shock and emerge with very different outcomes. What ultimately matters is not just exposure, but resilience. Strong external balances, healthy reserves and credible policy frameworks can help countries weather temporary disruptions and recover once conditions normalise.
For frontier market investors, that is a timely reminder that country fundamentals still matter far more than the headlines.
Leo Morawiecki is an investment specialist, fixed income, at Aberdeen.
ii is an Aberdeen business.
Aberdeen is a global investment company that helps customers plan, save and invest for their future.
These articles are provided for information purposes only. Occasionally, an opinion about whether to buy or sell a specific investment may be provided by third parties. The content is not intended to be a personal recommendation to buy or sell any financial instrument or product, or to adopt any investment strategy as it is not provided based on an assessment of your investing knowledge and experience, your financial situation or your investment objectives. The value of your investments, and the income derived from them, may go down as well as up. You may not get back all the money that you invest. The investments referred to in this article may not be suitable for all investors, and if in doubt, an investor should seek advice from a qualified investment adviser.
Full performance can be found on the company or index summary page on the interactive investor website. Simply click on the company's or index name highlighted in the article.