Facebook: What the stock price chart reveals
16th January 2019 12:40
by Alistair Strang from Trends and Targets
Due to publish fourth-quarter earnings on 30 January, technical analyst Alistair Strang looks to the charts for hints at where this tech laggard might head next.

While not being fans of social media platforms, it will be churlish not to concede that Facebook (NASDAQ:FB) share price is becoming a little interesting for the immediate future. Perhaps it's the US earnings season fever taking hold!
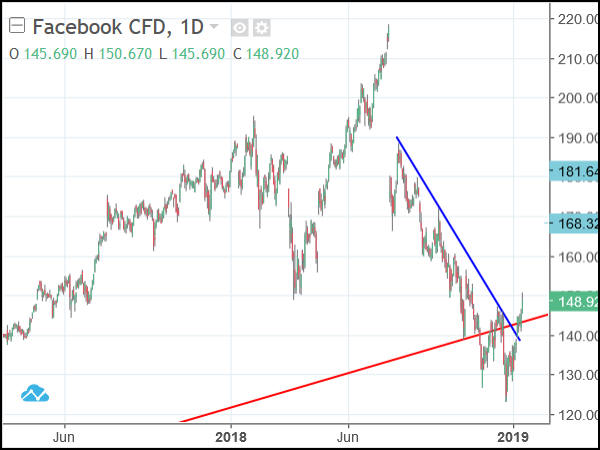
At present, we can suggest the scenario of movements above $151 allowing growth to an initial $168, a number which appears quite confident.
In the event $168 is bettered, we can calculate a secondary at $181, but for this ambition we're cautious, if only for the decision last July to drive Facebook's share price downward.
Given Facebook is due to release an earnings report at the end of January, it certainly starts to appear "buy on the rumour" is presently taking place.
The share price would require below $135 (blue on the chart) to allow for panic, along with a visit to $84.
Source: Trends and Targets Past performance is not a guide to future performance
Alistair Strang has led high-profile and "top secret" software projects since the late 1970s and won the original John Logie Baird Award for inventors and innovators. After the financial crash, he wanted to know "how it worked" with a view to mimicking existing trading formulas and predicting what was coming next. His results speak for themselves as he continually refines the methodology.
Alistair Strang is a freelance contributor and not a direct employee of Interactive Investor. All correspondence is with Alistair Strang, who for these purposes is deemed a third-party supplier. Buying, selling and investing in shares is not without risk. Market and company movement will affect your performance and you may get back less than you invest. Neither Alistair Strang or Interactive Investor will be responsible for any losses that may be incurred as a result of following a trading idea.
These articles are provided for information purposes only. Occasionally, an opinion about whether to buy or sell a specific investment may be provided by third parties. The content is not intended to be a personal recommendation to buy or sell any financial instrument or product, or to adopt any investment strategy as it is not provided based on an assessment of your investing knowledge and experience, your financial situation or your investment objectives. The value of your investments, and the income derived from them, may go down as well as up. You may not get back all the money that you invest. The investments referred to in this article may not be suitable for all investors, and if in doubt, an investor should seek advice from a qualified investment adviser.
Full performance can be found on the company or index summary page on the interactive investor website. Simply click on the company's or index name highlighted in the article.