Have stock markets kept pace with World Cup final ticket boom?
We pit the rising cost of attending international football’s showpiece event against the S&P 500.
11th June 2026 12:07
by Craig Rickman from interactive investor

Some 60 years ago, England Men’s football captain Bobby Moore held aloft the Jules Rimet trophy after the Three Lions defeated West Germany 4-2 after extra time to win the World Cup.
The historic victory, which took place on Saturday 30 July 1966 at Wembley Stadium, remains the men’s team’s sole piece of major silverware, and was witnessed by a crowd of 96,924.
- Invest with ii: SIPP Account | Stocks & Shares ISA | See all Investment Accounts
Those lucky enough to secure a seat at the final had to fork out £3.15, while standing tickets were available for 10 shillings (around 50p). These sound unbelievably cheap, and even after adjusting for inflation over the previous six decades, they remain remarkable value. In today’s prices, seats and standing tickets from the 1966 final equate to £52.61 and £8.35, respectively, according to the Bank of England’s inflation calculator. That’s an increase of 1,570%, with inflation averaging 4.78% a year during this period.
International football’s showpiece event hits North America this summer (the US, Canada and Mexico), with 48 countries battling it out to be crowned the globe’s best. The 2026 tournament’s first match, with co-hosts Mexico taking on South Africa, kicks off today at 8pm (UK time), and ticket prices are in stark contrast to 60 years ago, even after factoring in inflation.
For this year’s final, set for 19 July in New Jersey, prices are broken down into four categories and were initially valued as follows: Category 1 (best seats) at $6,730 (£5,048), Category 2 at $4,210 (£3,158), Category 3 at $2,790 (£2,093), and Category 4 at $2,030 (£1,523).
How much fans will actually pay is hard to accurately pin down as tickets are being sold on what’s called a dynamic basis, meaning they are adjusted over time using algorithms to reflect supply and demand. Category 1 tickets were reportedly dynamically adjusted to an eye-watering $32,970 (£24,597), with some on the resale site commanding over $1 million (£746,045). Whatever fans end up buying them for, the cost of a World Cup final ticket is far more expensive in “real terms” since the late Sir Bobby lifted the trophy.
Moneyball
In the past few decades, tickets for sporting events, notably the men’s football World Cup, have jacked up at an alarming pace. Prices for the 1994 World Cup final, the last time the tournament was held in North America, ranged from $180 (£134) to $475 (£355). In today’s prices, the range climbs to $390 (£291) to $1,029 (£769) - much higher than 1966 but much lower than 2026.
This 2026 event is on track to be by far the biggest of its kind in a financial sense. Around 75% of the globe will engage with the tournament, boosting global GDP to the tune of $41 billion (£30.6 billion), and creating almost one million jobs. Broadcasting rights and sponsorship revenues are both expected to hurtle past previous records, set to generate £4.3 billion and £2.8 billion, respectively, while attendance is anticipated to reach 6.5 million, double the previous high.
S&P 500 versus ticket prices
This explanation and the stats will do little to assuage the irritation among fans who want to attend the 2026 final but can’t afford, or don’t want to afford, the thousands of pounds needed to buy a ticket. And appetite will, of course be dictated by whether the nation you support reaches the final.
You might be wondering what all this has to do with personal finances. Well, the story behind World Cup final tickets prompted me to investigate something. Prices have clearly increased at a far quicker speed than the general costs of goods and services. But the question is, have other asset classes kept pace, namely equities?
- Analyst predicts FTSE 100 break above 12,000
- Ian Cowie: the top investment trusts since Brexit
- Tech stocks spooked by US inflation at 3-year high
I decided to examine returns from the S&P 500 Total Return index over the past 60 years and 32 years to coincide with two World Cup years mentioned in this article. The goal was to see whether investing a lump sum equal to the price of a final ticket in 1966 and 1994 would’ve held its value to fund a ticket at this year’s final.
Annoyingly, I could only source data starting at the end of 1971, meaning there’s a five-year gap in the comparison with England’s glory year. However, that should mean investing returns are slightly on the conservative side, especially as inflation averaged over 5% annually during this stretch.
I took the price of a seat at the final at Wembley 60 years ago and assumed it was deployed in the S&P 500 TR index (the FTSE 100, the UK’s main market had to be sidelined as it was only officially launched in 1984) on 31 December 1971.
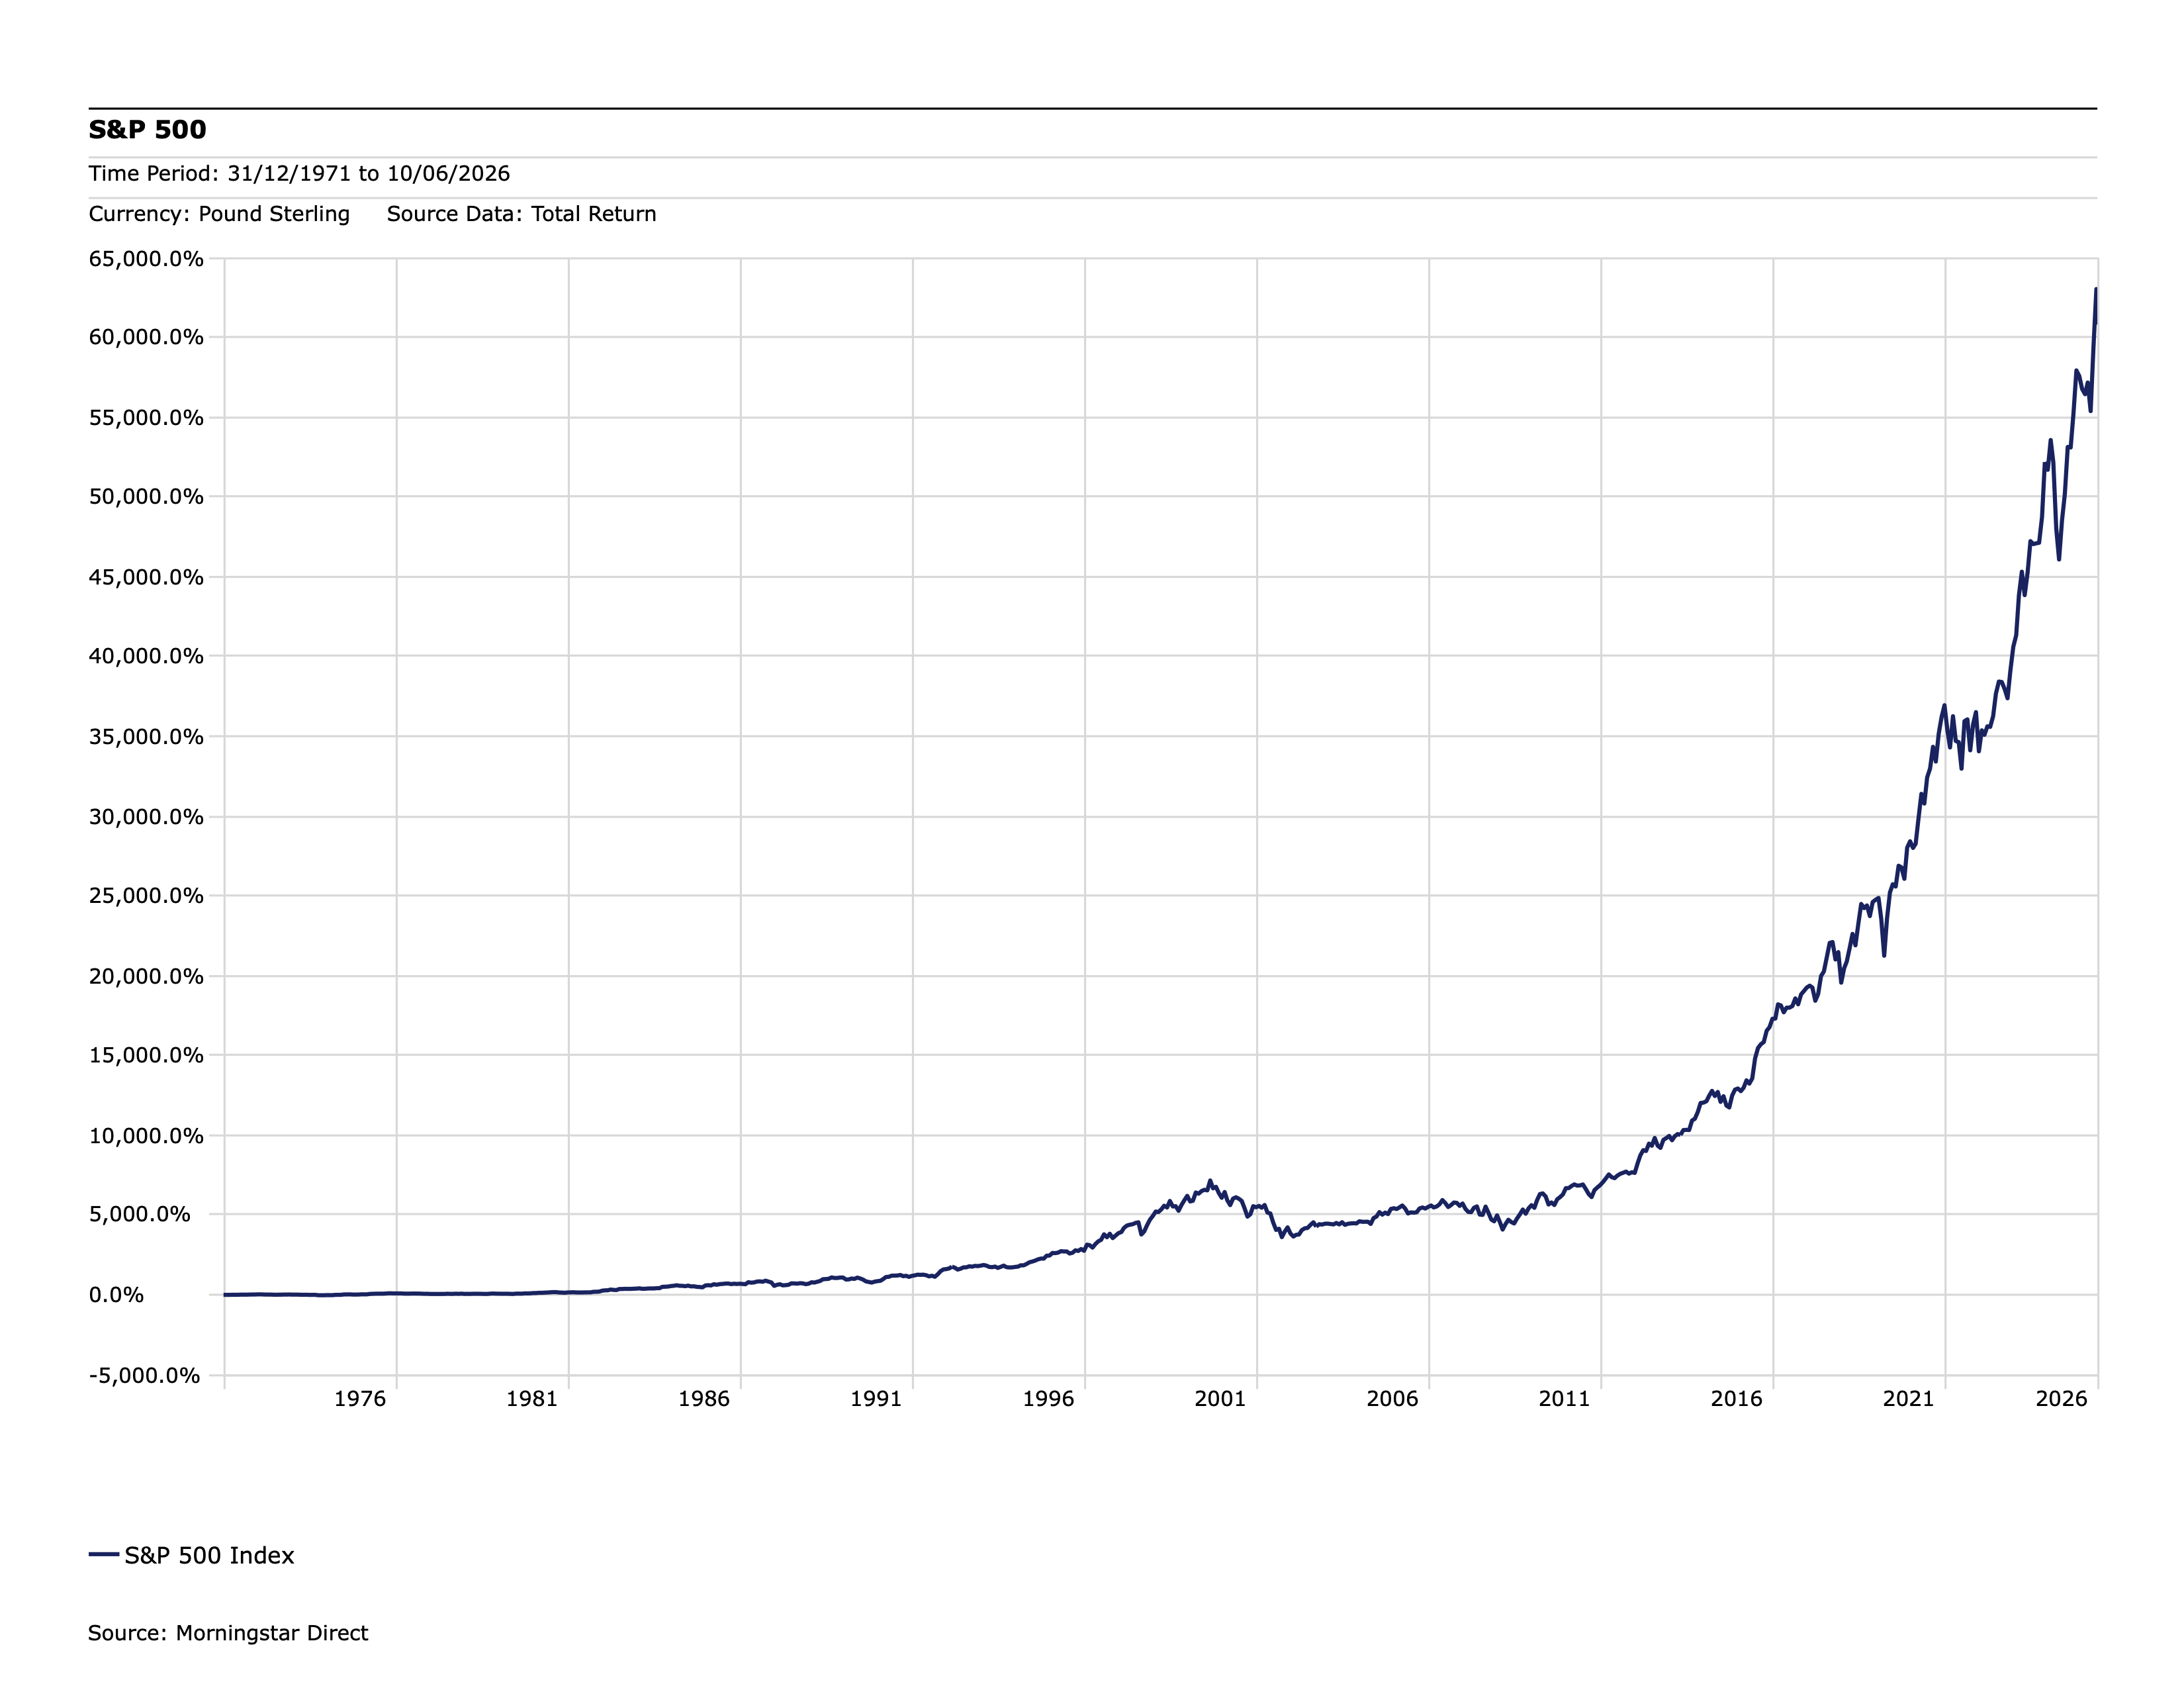
Source: Morningstar. Past performance is not a guide to future performance.
The results are eye catching. Over the period, the S&P 500 TR has returned a hefty 63,032%. So, if you’d invested £3.15 at the start, assuming dividends were reinvested, you’d be sitting on £1,986 today. That’s enough to buy a Category 4 ticket ($2,030 = £1,523) for this year’s final and almost enough for a Category 3 ticket ($2,790 = £2,093).
It’s also 37 times the amount you would’ve had if the money had merely maintained its value against inflation over this period.
Let’s explore the S&P 500’s returns from a more recent World Cup – 1994.
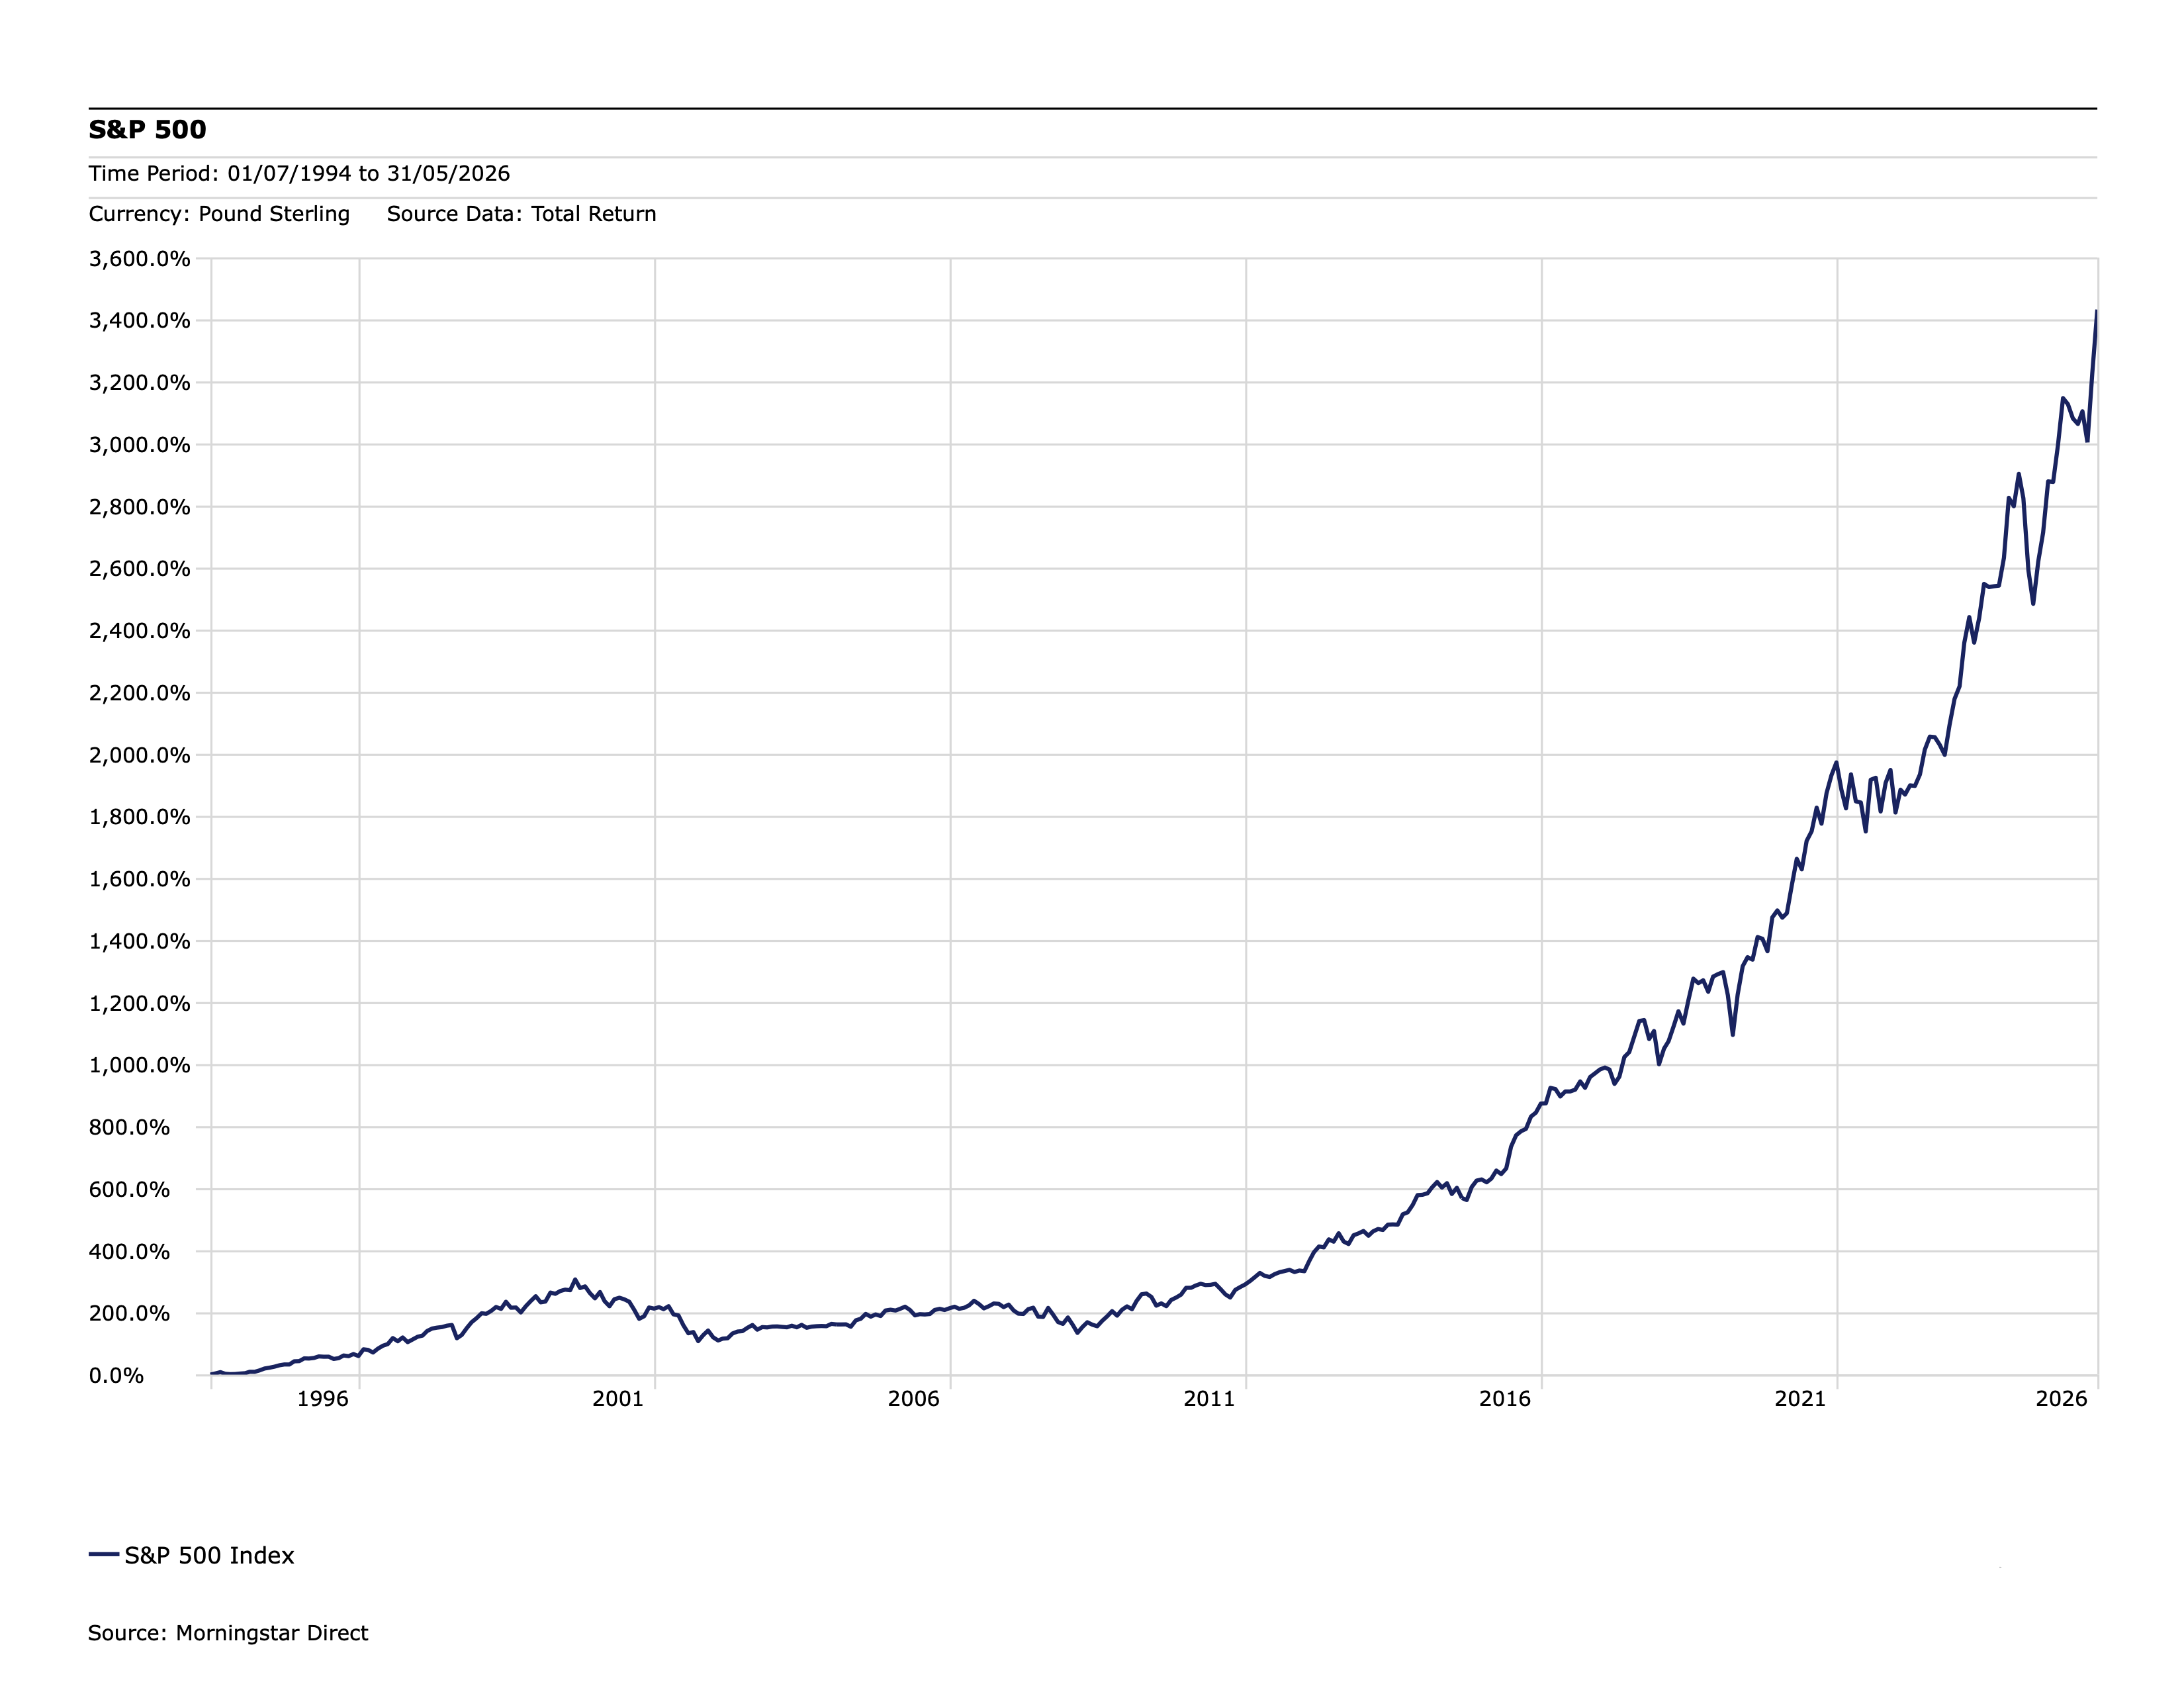
Source: Morningstar. Past performance is not a guide to future performance.
Since 1994, the index has returned 3,433% - so how does this stack up?
If you’d invested £134 (the cost of the lowest tickets) in 1994, again with dividends reinvested, you’d be sitting on £4,600 today, sufficient to afford a Category 3 seat at this year’s final. If you’d invested £355 (the top end of the ticket range), you’d have £12,185 – enough to buy two Category 1 seats and one Category 3 seat.
We should note that that these figures assume the base values of tickets, which as I’ve mentioned, are subject to fluctuation due to the dynamic pricing model. Many fans will have paid much more than these amounts.
An interesting aspect about the data between 1994 and 2026 is that inflation averaged 2.43% a year. This may, in part, help explain the investment returns, because as a rule of thumb stock markets tend to rise higher when inflation is rising at a slower pace.
Investing for glory
Admittedly, these comparisons are far from iron-clad and are more about illustrating the potential prize of investing versus sticking with assets that tend to track price rises, crowbarring the World Cup as a theme!
I appreciate that restricting assessments to a single index doesn’t reflect the strategies of many investors, who typically diversify equity holdings across global markets rather than anchor their hopes exclusively on one country’s fortunes. It also doesn’t take into account charges over the period, which if not managed correctly, can chip away at investment returns. The good news is that nowadays the costs for tracking an index such as the S&P are incredibly low.
But I do think the analysis flags, or perhaps more accurately reaffirms, some crucial investing behaviours.
As the charts show, the S&P 500 has experienced some rough patches over the measured periods – the index hasn’t risen in a straight line. But over time, investors who kept their eyes on the bigger picture have been richly rewarded, with inflation-beating increases to their wealth. Investors of all stripes need to mind the silent impact of price rises; if inflation rises by an extra one or two percentage points over a prolonged period the impact on our financial security can be significant.
One key aspect captured within these charts is the benefit of compound returns. When you automatically reinvest the dividends that you receive, it creates a snowball effect that becomes more powerful the longer you invest.
Something we shouldn’t overlook is that because investing has fared well in the past it is no guarantee of future success, although the figures above show the positive difference it can have to your wealth, especially over time. It all sounds very simple, but staying the course when investing for your future, keeping faith with the stock market and taking a long-term view, really could be your ticket to glory.
These articles are provided for information purposes only. Occasionally, an opinion about whether to buy or sell a specific investment may be provided by third parties. The content is not intended to be a personal recommendation to buy or sell any financial instrument or product, or to adopt any investment strategy as it is not provided based on an assessment of your investing knowledge and experience, your financial situation or your investment objectives. The value of your investments, and the income derived from them, may go down as well as up. You may not get back all the money that you invest. The investments referred to in this article may not be suitable for all investors, and if in doubt, an investor should seek advice from a qualified investment adviser.
Full performance can be found on the company or index summary page on the interactive investor website. Simply click on the company's or index name highlighted in the article.