A must-read prediction of future gold price activity
17th September 2018 08:44
by Alistair Strang from Trends and Targets
Gold has been on a steep decline as the dollar strengthens and now sits at a crucial level. Chartist Alistair Strang looks at where the yellow metal is heading next.

Some Golden Thoughts. In dollars! (COMEX:GC)
FACT: Golden Retrievers never, ever, retrieve gold! We have two at home and both have proven failures. Otherwise, any time we mention a commodity, we prefer using the "Rolling Daily" values rather than confuse the issue by pricing up monthly futures contracts. Our method gives a firm indication of direction, something generally lacking due to the last of historical data for a new contract period.
Thankfully, most companies dealing in gold futures appear to be using "Rolling Daily" to give spot prices whereas, rather madly, quite a few chart providers attempt to give Futures or Option contract prices. It sometimes feels they all revel in providing a confusion of information.
Our own attitude is fairly simple. We collate the numbers since the beginning of time and measure strength of movements. Only then do we risk confusion by projecting movements which have not yet happened!
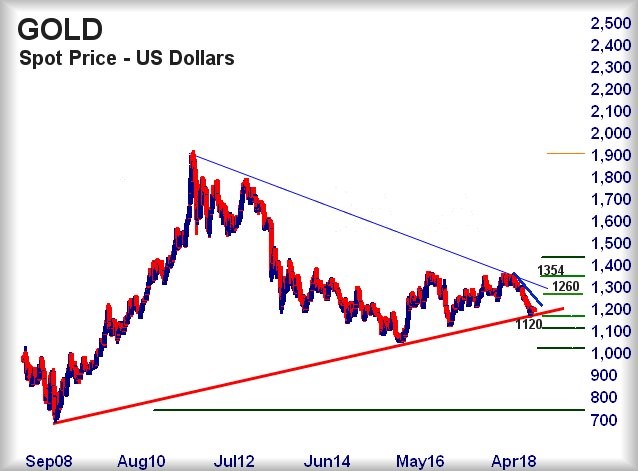
At time of writing, Gold Spot is trading around $1,193.4 and it has a problem should it continue to weaken below $1,180. For some reason, the $1,180 number has assumed a degree of self importance and the immediate situation calculates - quite firmly - of market closure below $1,180 opening the door for further weakness down to $1,120 dollars.
We would expect some sort of bounce at the $1,120 point. But should the Spot Price close a session below $1,120, we shall next mention $1,025 as the eventual bottom. Interestingly, the visuals suggest some sort of real bounce can be planned for at such a point, given the prior lows of three years ago.
Surprisingly, the market does not require much action to escape the immediate pace of descent. The thick blue downtrend line is currently at $1,230 and movement above calculates with an initial target at $1,260. In itself, this is fairly useless but does tick a faint box to suggest the price has bottomed.
The secondary target, if $1,260 is bettered, comes in at $1,354 and betters the downtrend since 2010. Unfortunately, if this set of circumstance arises, the visuals demand any rise should stutter at the $1,354 level, simply due to the glass ceiling which lies in wait.
Unless, of course, a world leader manages do something stupid!
For now, we shall not be aghast if $1,120 eventually makes an appearance.
Source: interactive investor Past performance is not a guide to future performance
Alistair Strang has led high-profile and "top secret" software projects since the late 1970s and won the original John Logie Baird Award for inventors and innovators. After the financial crash, he wanted to know "how it worked" with a view to mimicking existing trading formulas and predicting what was coming next. His results speak for themselves as he continually refines the methodology.
Alistair Strang is a freelance contributor and not a direct employee of Interactive Investor. All correspondence is with Alistair Strang, who for these purposes is deemed a third-party supplier. Buying, selling and investing in shares is not without risk. Market and company movement will affect your performance and you may get back less than you invest. Neither Alistair Strang or Interactive Investor will be responsible for any losses that may be incurred as a result of following a trading idea.
These articles are provided for information purposes only. Occasionally, an opinion about whether to buy or sell a specific investment may be provided by third parties. The content is not intended to be a personal recommendation to buy or sell any financial instrument or product, or to adopt any investment strategy as it is not provided based on an assessment of your investing knowledge and experience, your financial situation or your investment objectives. The value of your investments, and the income derived from them, may go down as well as up. You may not get back all the money that you invest. The investments referred to in this article may not be suitable for all investors, and if in doubt, an investor should seek advice from a qualified investment adviser.
Full performance can be found on the company or index summary page on the interactive investor website. Simply click on the company's or index name highlighted in the article.