FTSE for Friday: heading for a market correction?
Independent analyst Alistair Strang shares his thoughts on the FTSE 100, comparing the blue-chip index with American markets.
5th June 2026 09:29
by Alistair Strang from Trends and Targets

Since the start of April, the FTSE 100 has been manoeuvring on an imaginary track 400 points wide and providing very little in the way of entertainment.
For the future, we’re inclined to anticipate the worst because this is the FTSE 100, an index always ready to disappoint both participants and spectators.
- Invest with ii: SIPP Account | Stocks & Shares ISA | See all Investment Accounts
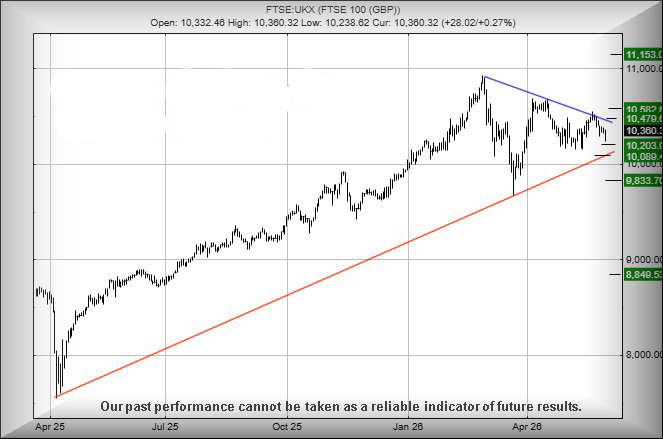
At present, there’s a threat that weakness below 10,238 points will trigger reversal to a tame near-term 10,203 points and perhaps a bounce.
However, a break of 10,203 points could signal trouble, powering reversal to 10,080 points with our big-picture secondary coming in at a hopeful “bottom” of 9,833 points. To indulge a bout of hysteria, this could easily prove to be the start of a proper market “correction”, probably to be blamed on AI optimism collapsing. As a result, the big picture gives the potential of a “real” bottom working out at a ridiculous-looking 8,840 points...
Of course, there’s always a “however”, and in the case of the FTSE, it may come from the strength of Wall Street, an index which has been achieving “higher highs” every few days recently.
Perhaps some of this optimism from the American market will spill across the pond to infect folk in the UK. To be fair, we’ve been expecting a visit to 10,200 for a while and the fact that the UK index has avoiding impaling itself at such a level maybe indicates some well-hidden strength.
Should this indeed be the case, we can throw some near-term numbers into the frame, as above just 10,378 points should apparently trigger movement to an initial 10,470 points with our longer-term secondary, if beaten, at 10,582 points.
While this would initially suggest that the index is once again swerving across its 400-point wide track, this time it is opening the door for a third-level target if the secondary is exceeded, an impressive 11,153 points and another new all-time high.
We can hope the UK market intends to follow the US example.
Source: Trends and Targets. Past performance is not a guide to future performance.
Alistair Strang has led high-profile and "top secret" software projects since the late 1970s and won the original John Logie Baird Award for inventors and innovators. After the financial crash, he wanted to know "how it worked" with a view to mimicking existing trading formulas and predicting what was coming next. His results speak for themselves as he continually refines the methodology.
Alistair Strang is a freelance contributor and not a direct employee of Interactive Investor. All correspondence is with Alistair Strang, who for these purposes is deemed a third-party supplier. Buying, selling and investing in shares is not without risk. Market and company movement will affect your performance and you may get back less than you invest. Neither Alistair Strang or Interactive Investor will be responsible for any losses that may be incurred as a result of following a trading idea.
These articles are provided for information purposes only. Occasionally, an opinion about whether to buy or sell a specific investment may be provided by third parties. The content is not intended to be a personal recommendation to buy or sell any financial instrument or product, or to adopt any investment strategy as it is not provided based on an assessment of your investing knowledge and experience, your financial situation or your investment objectives. The value of your investments, and the income derived from them, may go down as well as up. You may not get back all the money that you invest. The investments referred to in this article may not be suitable for all investors, and if in doubt, an investor should seek advice from a qualified investment adviser.
Full performance can be found on the company or index summary page on the interactive investor website. Simply click on the company's or index name highlighted in the article.