Have Wall Street bulls got it right?
After surging on better-than-feared jobs data, our chartist decides if the Dow Jones can keep it up.
8th June 2020 09:02
by Alistair Strang from Trends and Targets
After surging on better-than-feared jobs data, our chartist analyses whether the Dow Jones can keep it up.
Dow Jones (DOWi:DJI)
Dislocating a shoulder, due to our ‘FTSE for Friday’, ensured a good weekend! We projected 6,482 points.
The market closed at 6,484 points and 2.2% up, justifying a hard self-inflicted thump on the back. Then we noted our last review of the Dow Jones at the end of a miserable March that included a "HOWEVER" in capital letters, essentially suggesting reservations over our negative analysis.
This particular "however" threatened a surprise recovery of 2,000-plus points.
Due to the Dow Jones presently surfing around 27,000 points, we should probably update our thoughts as it has outstripped all near-term logic.
Chatting to a trader, mentioning the US market had "only" recovered a couple of million jobs in Friday's report should be seasoned against the reality that the country had lost over 20 millions jobs due to the pandemic.
His immediate, glib answer; 'they'll all come back, no worries'. This also tends to disregard the threat of further coronavirus issues, due to large numbers demonstrating and visually ignoring any demand for social distancing.
It all feels slightly mad, yet this attitude doubtless assisting the US market achieving a stonking 3.1% up day on Friday.
We truly hope we shall not see a return to large numbers of people suffering further Covid-19 infections in just a few weeks. Obviously, this shall once again risk a panic response by government, along with another hammering for share prices.
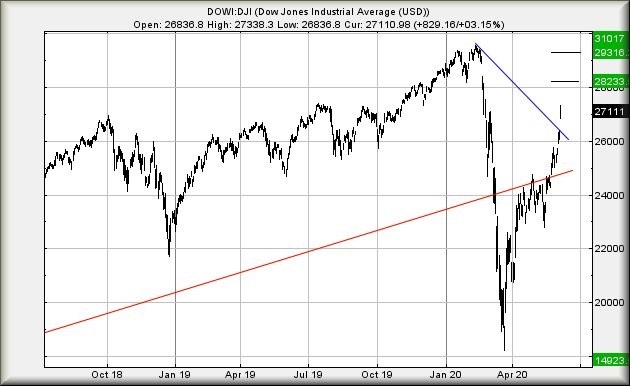
As for Wall Street, the Dow Jones index, is concerned it has now outperformed the Covid-19 drop and has eased into territory where some quite extraordinary figures are allegedly available. Next above 27,340 will be seen as entering a further cycle to an initial 28,233 points.
If exceeded, secondary works out at 29,316 points. Glancing at the chart below, the secondary ambition feels truly immoral, an attempt at the previous all time high against a background of the USA suffering a 100,000 death toll.
If we apply our "if it were a share" argument, we're able to now point out the Dow has a longer-term ambition above 31,000 points.
For it all to go wrong, Wall Street needs to slip below blue on the chart to start alarm bells ringing loudly. Presently, this critical level is at 26,250 points.
We would warn that any market movement capable of "gapping" the index back below blue screams one thing. 'Go short and wait!'.
Source: Trends and Targets. Past performance is not a guide to future performance.
Alistair Strang has led high-profile and "top secret" software projects since the late 1970s and won the original John Logie Baird Award for inventors and innovators. After the financial crash, he wanted to know "how it worked" with a view to mimicking existing trading formulas and predicting what was coming next. His results speak for themselves as he continually refines the methodology.
Alistair Strang is a freelance contributor and not a direct employee of interactive investor.
All correspondence is with Alistair Strang, who for these purposes is deemed a third-party supplier. Buying, selling and investing in shares is not without risk. Market and company movement will affect your performance and you may get back less than you invest. Neither Alistair Strang, or interactive investor will be responsible for any losses that may be incurred as a result of following a trading idea.
Alistair Strang has led high-profile and "top secret" software projects since the late 1970s and won the original John Logie Baird Award for inventors and innovators. After the financial crash, he wanted to know "how it worked" with a view to mimicking existing trading formulas and predicting what was coming next. His results speak for themselves as he continually refines the methodology.
Alistair Strang is a freelance contributor and not a direct employee of Interactive Investor. All correspondence is with Alistair Strang, who for these purposes is deemed a third-party supplier. Buying, selling and investing in shares is not without risk. Market and company movement will affect your performance and you may get back less than you invest. Neither Alistair Strang or Interactive Investor will be responsible for any losses that may be incurred as a result of following a trading idea.
These articles are provided for information purposes only. Occasionally, an opinion about whether to buy or sell a specific investment may be provided by third parties. The content is not intended to be a personal recommendation to buy or sell any financial instrument or product, or to adopt any investment strategy as it is not provided based on an assessment of your investing knowledge and experience, your financial situation or your investment objectives. The value of your investments, and the income derived from them, may go down as well as up. You may not get back all the money that you invest. The investments referred to in this article may not be suitable for all investors, and if in doubt, an investor should seek advice from a qualified investment adviser.
Full performance can be found on the company or index summary page on the interactive investor website. Simply click on the company's or index name highlighted in the article.