How you know if you've won the wealth game
14th December 2018 13:26
by Peter Alcaraz from interactive investor
Former lawyer and City money man Peter Alcaraz reveals a new and fiendishly simple tool which makes financial planning fun and accessible to all.

Peter Alcaraz read law and economics at Durham University and spent 24 years advising small and mid-sized companies on mergers, acquisitions, IPO's and fund raisings, first as a lawyer and for the last 20 years in corporate finance. At the age of 46 after reaching 'O' he left city life to write, study, travel and spend more time with his wife and two daughters. His first book, The Wealth Game - an ordinary person's companion was published in 2016 and has become a staple among wealth managers, business schools and private individuals wishing to develop their personal finance skills.
How do you know if you've won the wealth game? Is there a reliable shortcut and easy to apply method which shows your position in the game?
The traditional (and long) method of addressing the question is to build a forward cash flow projection for all incomings and outgoings as they are expected to arise over the forecast period and factor in assumptions for cost inflation and investment returns. Feeding into this is a projected balance sheet showing the value of net assets and taking account of gains and losses, additions and withdrawals.
The cash flow can be measured weekly, monthly, quarterly, or annually. It is like treating you as a business enterprise and seeking to predict and quantify every activity and event that affects you financially for the rest of your life.
This approach is fraught with difficulties not least that it's not set up to deliver a clear and unequivocal answer 'yes you have reached O' or 'no you have this far to go'. Conclusions tend be hedged and qualified.
Furthermore, granular and detailed inputs and outputs promote a sense of spurious accuracy—in other words the exercise feels and looks scientific but isn't. Time horizons may be very long (fifty-plus years) making detailed annual forecasting meaningless. Results are highly sensitive to rates of future cost inflation and investment return which are impossible to predict with certainty. Advanced financial modelling skills are needed and if done properly the exercise is extremely time consuming and complicated which means costly if someone is doing it for you. Finally, answers are quickly out of date and repeating the exercise is burdensome.
The NAN Test
Welcome to the 'net assets to needs' or 'NAN' test, a new and fiendishly simple tool which bypasses most of these difficulties and in doing so makes financial planning fun and accessible to all!
It's the natural extension of your net worth and needs calculations discussed in articles two and three of this series. A reminder : net worth is today's value of all your assets less all debts; needs are today's value of your chosen expenses over your remaining life (I model up to 90). The new and clever bit here is the needs side.
Textbook planners may wince at some of the liberties but the basic structure is sound. It's free and straightforward to use and delivers enough for planning and making decisions year after year. When the time comes to retire from paid work permanently you can test your conclusions by doing a detailed cash flow modelling exercise with a financial planner.
If your needs are £2 million and your net worth £500,000 your NAN gap is negative 1.5 million, NAN ratio is 25% (net worth / needs x 100) and NAN cover is 0.25 x (net worth / needs). At £2 million apiece, NAN gap is zero, NAN ratio is 100% and cover is 1x. Net worth of £2.8 million versus needs of £2 million equals a NAN gap of +£800,000, a NAN ratio of 140% and cover of 1.4x.
If your NAN cover is around 1x you're in the final phase of the game and it's worth drilling into the detail a bit more. If you're comfortably over 1x you should be actively testing and retesting. If you are miles away, avoid getting hung up on detail but play with the major inputs in your needs total to see how they change matters.
One of the many things I like about the test is that whatever the result, it asks every important question about your personal finances. Think about that...what does it miss out? Another, is that it delivers immediate feedback and signposts - tinkering with it is easy and fun as you watch cause and effect starkly play out. This encourages behaviours which help you reach O.
To make fair and prudent comparison between the two, however, your net worth calculation needs slight adjustment and the effects of asset returns and cost inflation considered.
First, remove depreciators other than cash and bonds, as well as all consumables from your net worth. Only assets which can be relied on to service future needs count.
You might think this harsh in the case of luxury items that you can live without and that have a genuine (albeit declining) sale value, such as boats and caravans. It’s up to you how prudent you want to be but the NAN test is a shortcut founded on prudence and it works properly only if the assets you count produce an income or will definitely appreciate in value over time.
Next, if you haven't already done so, add today's value of your private or state pensions to your net worth.
To convert future income receipts into a balance-sheet sum, add them up in today's value for all the years you expect them to continue and then adjust for tax. A state pension of £6,000 per annum in today's money over twenty-three years, say from age 67 to 90, is £138,000 before tax. To be prudent, deduct tax at your expected marginal rate; after 20% basic-rate tax, £110,400 would be added to your net worth. Do the same for guaranteed defined benefit annuities or alternatively include in your balance sheet the transfer value of your annuity on the open market after tax.
For private defined contribution pensions including SIPPs,work out the after-tax value of the pot after accounting for any reliefs and allowances and making reasonable provision for tax payable on withdrawals.
If you have debt I recommend that you deduct from your net worth not just the principal amount outstanding but also today's value of the interest due over the lifetime of the loan. It is a real cost that shouldn’t be ignored. You should factor in the terms of your debt package, whether it is fixed or variable rate, and the effect of special deals ending to arrive at a prudent figure.
Arguably, capitalising future interest payments on debt and adding them to your needs is unnecessarily tough. It assumes that all interest is due today which it isn’t and that its current rate will go on rising with inflation each year of the forecast which it won’t. To shortcut this dilemma, include debt principal only and nudge up your target NAN ratio a few notches.
It’s now time to factor in the effects of asset returns and cost inflation. You may recall that by capitalising all numbers at today's values you set aside the effects of time value of money on your assets and future needs. As things stand, your net-asset-and-needs totals can't be meaningfully compared until you have decided how each one will grow into the future. The cost of your chosen needs will rise or fall with market prices and over time it will inflate. The question is, at what rate? Similarly, your assets should produce income or capital returns over time, but again, at what rate?
If both rates are the same and move in tandem (so they rise or fall together) you reach O as soon as your NAN cover is 1x. It doesn't matter when your needs arise or in what quantities they are incurred since you will have corresponding assets of the same value to match them.
In practice the rates diverge; it is virtually impossible to construct an asset base that grows at the same rate as your needs over a long period. There will be a divergence either for better or worse and timing differences. You will suddenly have a surplus or shortfall and no longer are you indifferent as to when your needs arise.
I have run numbers for a range of scenarios to offer a ready 'reckoner'. The three forecast periods of 30, 40, and 50 years are based on a current age of 60, 50, or 40 and a life expectancy of 90. For each of these time periods, there are six rate scenarios. The first three assume that cost of your chosen needs rise faster than asset returns by 1% to 3% per annum. The second set is reversed, showing asset returns beating cost inflation by 1% through to 3%.
The results show the required starting net assets as a percentage of today’s needs total. Where growth rates are expected to be equal, starting net assetsare 100% of needs whatever the period.
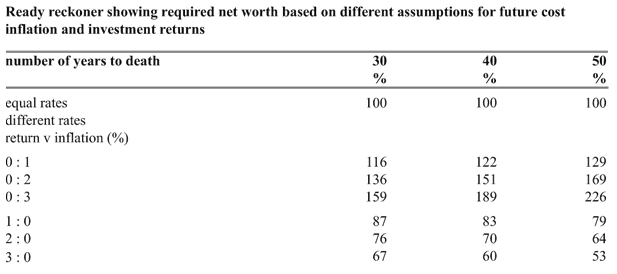
If your investment returns exceed needs inflation by 3% per annum over a 50-year period you require net assets equal to only 53% of your starting needs total while a reverse differential leaves you needing 226% of needs. This staggering difference is worth illustrating further.
Let's say that your needs total is £1.5 million over the next fifty years. On the +3% per annum scenario you reach O when your net assets are £795,000 (0.53 x £1.5m) but at −3% per annum you must accumulate £3,390,000 (2.26 x £1.5m) to finish the game!
A tweak to your target NAN ratio deals with this (albeit bluntly) so no need to get too caught up in the detail. The table is here to highlight the vital importance of asset stewardship, so (i) making your assets work for you and (ii) earning returns that beat inflation. The ordinary person, weighed down with the challenges of earning, providing and saving, too often has little or no time to properly address this. For all your laudable efforts you might as well be peeing into a force ten gale. Somehow you need to turn around face the other way and let the wind work for you.
How does the timing of spend affect the outcome? Fortunately, not hugely and again, a tweak to your target NAN ratio deals with the issue. Logic dictates that if your needs are inflating faster than your assets the sooner you incur them the better, while if assets are growing faster, deferring needs will enhance your wealth. Generally, you should be in the latter camp.
My book shows the effects in detail but in short, outcomes are more sensitive to inflation and return rate differential than to time. When incurring your needs early you must set aside more net assets to meet them if you think your asset returns will beat cost inflation but can rely on lower starting assets if you expect your assets to underperform.
What does all this mean in practice? For my own planning, I assume that my after-tax return on assets will equal the cost inflation of my needs, in effect a 100% NAN ratio or 1× NA cover. This may sound undemanding but remember that all tax is deducted from asset returns before comparing them with needs. A manageable target as well as being prudent also acts as an incentive to overdeliver.
Since giving up full-time work in 2009 my after-tax asset returns have beaten cost inflation each year. As my needs have slimmed and gradually unwound, the result has been a consistently strengthening NAN ratio. The extra safety margin will be useful in a downturn and when I start to loosen the belt a notch or two.
What Is the Right NAN Ratio?
Just as you set O by designing and costing your future needs, so you must also choose a NAN ratio that you trust and believe in. There is no universal answer.
In capitalising your future needs and taking a view on asset returns versus cost inflation you are forecasting the future in a changing world. The risks are either underestimating your needs or the rate at which they'll inflate or overestimating your net assets or their future returns.
You should assume that all your calculations so far include a built-in bias towards the positive. O is too valuable a prize and human nature is too predictable to remove the positive fudge factor. Furthermore, investment losses, tax rises and unexpected mishaps will damage your finances.
But how prudent should you be? Anyone can provide for so many contingencies that running out is beyond imagination in all scenarios but Armageddon. This misses the point that your goal is to reach O without delay. If you have mastered the art of needs management your confidence will be great and you can survive comfortably with a small safety buffer for overspending and rash actions. If not, you should set a higher margin. Similarly, if you have years of successful asset management behind you and are comfortable with your asset classes, you can trim the protection required to cater for mistakes and lower asset returns.
Before deciding on the size of your safety margin here’s a reminder of some of the prudence and protections already contained in the NAN test:
Needs
The test encourages you to be prudent at every stage, to include your fullest possible needs in each category and to avoid overly scientific attempts to allocate or reduce them. For example, assumptions that you will spend steadily on holidays and living expenses overlooks the fact that some time before reaching ninety your appetite for travel and adventure will probably wane and that household and dependants should cost less. In some years, you may not travel at all and for a period you may live on your own.
Further overestimates may include work-related costs—for example, my living costs have fallen considerably as a result of not working as I used to. I have no commuter travel or work-related accommodation costs, I don't wear a suit and tie or buy sandwiches for lunch and I have replaced private gym membership with a community leisure centre. When I do go somewhere I travel off-peak and take my time.
This releases over £8,000 each year, equivalent to a pre-tax sum of £10,000 for a 20% taxpayer and £13,300 for a 40% taxpayer. Over forty years the after-tax saving of this alone is £320,000 in today's money and that’s before the compounding benefit available by putting the savings to work. Some of this is offset by greater leisure spending but a good surplus remains.
The biggest inbuilt protection on the needs side is your ability to manage them down. Beyond subsistence and absolute necessities every element can be reduced or eliminated, perhaps not instantly but certainly over time.
As the architect of your needs you have the power to decide your final home value, choice of schooling for your children, legacies, cars, holidays, lifestyle, care provision and so on and you can change your mind on these as you go.
Net Assets
As the test includes only cash, bonds, or appreciators, proceeds of sale from any other depreciators or consumables add to your sources.
The large inbuilt protection is that you record your assets at after-tax values rather than gross and then apply return assumptions to this lower figure. In practice you earn returns on the gross figures—for example rental yield on a property is set on its market value rather than after tax value to you. If the return beats inflation, the positive effect is exaggerated further still.
Another big positive is the effect of compounding returns on any net assets that exceed your needs. Assume that you have NAN cover of 1.5x and hold net assets of £1.25m against needs of £1m. If after tax returns on your first £1m of assets keep up with inflation of your needs you'll have a 'spare' £250,000 to grow each year. Over five years at 5% per annum after taxes, this would be nearly £320,000*. The protection itself adds more protection!
Calculation below.

Returning to the question of what is the right NAN ratio for you, it is fair to plan that after taxes your assets will at least keep up with cost inflation although this does require that you don’t have a large portion of your assets in cash earning less than inflation. If you do and plan to stay this way for a while, it would be sensible to increase your starting NAN ratio target slightly, say to 1.05× or 1.1×.
In my own calculations, as mentioned, I assume asset returns will match needs inflation, but add 25% for investment losses and 15% for additional needs making my NAN ratio target 140%, or 1.4×. Applying this cover level to a needs total of £2 million would therefore require available assets of £2.8m; needs of £4 million would require assets of £5.6 million.
Of course, once you're through O, the ratio ceases to be a target but an indicator. If it rises too high you know that you can de-risk your assets or spend / give more away, whereas if it falls below your comfort level you can tighten the belt slightly and make your assets work harder.
In 10 years or so, once the children are off our books, I will work to a lower ratio. First, there will be no single big needs items to budget for, secondly, a shorter forecast period means less margin for error and finally, we’ll be well into inheritance tax planning.
A ratio of 1.7× or more is strong but as a target on route to O begs the questions: whether you are working and accumulating too long or have limited faith in your asset or needs management capabilities.
Run the test now however flimsy your numbers are. From the first minute it will get to you. The best way to start is with rough (even fictional) numbers. Spending too long tailoring the inputs disrupts the flow. The trick is just to play with numbers to see how the outcomes change. The results will enlighten and many of you will recheck the calculations and methodology frequently in disbelief. Very large needs numbers can be produced without effort even before adding any safety margins.
At this stage, treat it like an abacus with coloured balls that you can flick from end to end making patterns and shapes. In time it becomes a valuable tool. You may put it away for long periods but once used, it can't be completely forgotten. It calls out to be played with. Every year that passes on route to O, your needs total unwinds whilst your assets should increase in value, a double benefit. At some point the numbers will converge.
A variant on the exercise is to try to create the lowest set of needs you can imagine living with and cost that. In a developed western country, it's a challenge to keep a forty-year needs total under £1.8m. An after-tax living income of £30,000 per annum, so £2,500 per month amounts to £1.2 million on its own; adding a £350,000 final home leaves only £250,000 or £6,250 per annum for all holidays, cars, other luxuries and emergencies and that's before the costs of any children and end-of-life care.
For less of a hairshirted approach, unless you are single and childless, a 40-year needs total of nearer £2-3 million is more realistic. If you apply my 40% safety factor, this raises the asset requirements to £2.8–£4.2 million.
So, what do you win by reaching O? Read next time to discover….
Peter Alcaraz is a freelance contributor and not a direct employee of interactive investor.
These articles are provided for information purposes only. Occasionally, an opinion about whether to buy or sell a specific investment may be provided by third parties. The content is not intended to be a personal recommendation to buy or sell any financial instrument or product, or to adopt any investment strategy as it is not provided based on an assessment of your investing knowledge and experience, your financial situation or your investment objectives. The value of your investments, and the income derived from them, may go down as well as up. You may not get back all the money that you invest. The investments referred to in this article may not be suitable for all investors, and if in doubt, an investor should seek advice from a qualified investment adviser.
Full performance can be found on the company or index summary page on the interactive investor website. Simply click on the company's or index name highlighted in the article.