Two surprising charts and what they tell us about these trusts
A Kepler analyst focuses on the UK closed-ended funds beating the S&P 500 despite the negativity towards our domestic trusts.
23rd October 2026 14:00

This content is provided by Kepler Trust Intelligence, an investment trust focused website for private and professional investors. Kepler Trust Intelligence is a third-party supplier and not part of interactive investor. It is provided for information only and does not constitute a personal recommendation.
Material produced by Kepler Trust Intelligence should be considered a marketing communication, and is not independent research.
One of the weirder moments in the B****t wars was when social media users fought over the use of Union Jack flags on vegetables in British supermarkets. A surprising number of people who were apparently capable of using full sentences and finding the internet viewed this as a retrograde, fascistic step and indicative of how nasty Little Britain was becoming in its new dark age. What their comments really showed is that they had never lived abroad, because, as anyone who has done so would know, every country’s supermarkets stick flags and proud claims of national origin on their food and have always done so. The point is: if you only know your own country, what do you really know about it?
Britain is very focused on its own economic problems, but it doesn’t shape up too badly by international standards. This was the message of the IMF’s report last week, which was met with rather a lot of surprise and scepticism. But the numbers are clear. Rising gilt yields are a problem, but there are plenty of countries more likely to have a fiscal crisis before the UK.
Britain’s fiscal deficit is 3.8% and falling. This compares to 5.4% in France and 8.5% in the US. Gross government debt sits at 104% of GDP versus 119% for France and 127% for the US. UK economic growth of 1.3% is higher than all G7 countries except the US, and level with Germany’s. For all the political mud-slinging, the general economic approach of the governments in the current parliament hasn’t been drastically different from the last Conservative government, in the basic focus on fiscal discipline.
We could make a similar argument when it comes to the health of the stock market. While the UK frets about delistings and takeovers, this is a global phenomenon which has hit our European neighbours hard too. The number of listed companies on the Euronext Paris exchange has halved since 2006. In the US, there has been a 37% decline over the same period. There is a real issue about valuations in the UK, but a large part of the deequitisation going on is attributable to global factors.
The problem for investors is that poor sentiment is itself a driver of poor returns, and with sentiment towards the UK particularly dire, investors may quite reasonably be sceptical about the market’s prospects. However, investment trusts focused on undervalued UK equities have actually outperformed the S&P 500 over the past three years, even though the mood music has been relentlessly negative on the UK and the US has benefited from the impact of AI on the tech sector.
The chart below shows the returns of Aberforth Smaller Companies Ord (LSE:ASL)and Fidelity Special Values Ord (LSE:FSV), which sit in the AIC UK Smaller Companies and AIC UK All Companies sector respectively. In the three years ending 13/10/2026, FSV’s NAV total return of 75.8% and its share price total return of 92.9% were well ahead of the 69.8% sterling return to the S&P 500. While ASL’s NAV total return was slightly behind, at 65.6%, the share price total return was 74%. So, investors in both would have outperformed the famous low-cost tracker.
THREE-YEAR PERFORMANCE
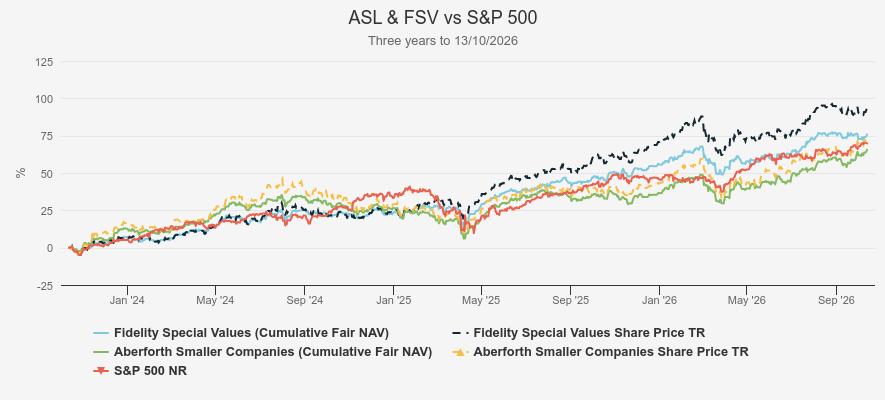
Source: Morningstar. Past performance is not a reliable indicator of future results
In the depths of the market, in the micro-cap segment, both trusts have also outperformed the all-conquering S&P. As the chart below shows, Rockwood Strategic Ord (LSE:RKW)’s NAV is up 71.7% and River UK Micro Cap Ord (LSE:RMMC) 75.9% over the same period, and the share prices of both have done even better.
THREE-YEAR PERFORMANCE
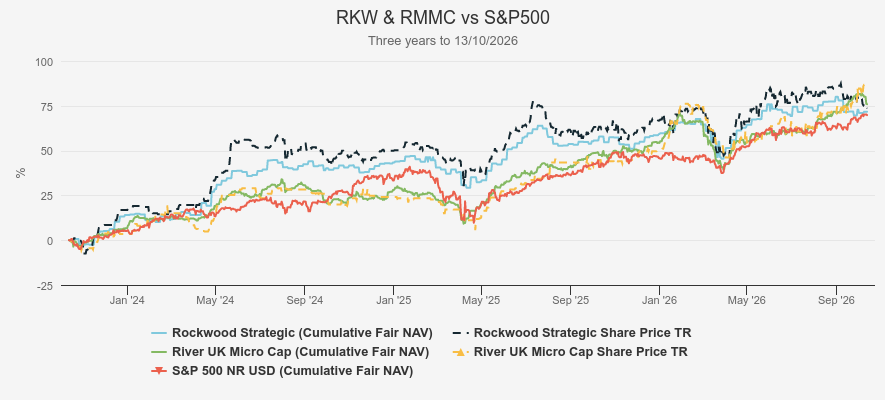
Source: Morningstar. Past performance is not a reliable indicator of future results
These charts were pretty surprising to us, and we expect they are to many readers too. We think they just underline the point that waiting for sentiment to turn is a fool’s errand. Sentiment will turn back towards UK equities when investors have made much more in their UK funds than their US or tech funds, but by then much of the outperformance will have been earned.
While we don’t think there is an AI bubble as such, we do think the market is becoming more discerning, and returns to tech-heavy indices will diminish. Anthropic’s slowing revenue growth and China chip-maker CXMT’s claims of a breakthrough in DRAM technology are two bits of news from last week which highlight the AI story is becoming more complicated, and investors should be looking elsewhere for growth.
With UK valuations so low and higher rates likely for longer, we think the backdrop for value-focused strategies remains superior to that for growth strategies, although the time will eventually come for that even more out-of-favour strategy too.
Kepler Partners is a third-party supplier and not part of interactive investor. Neither Kepler Partners or interactive investor will be responsible for any losses that may be incurred as a result of a trading idea.
These articles are provided for information purposes only. Occasionally, an opinion about whether to buy or sell a specific investment may be provided by third parties. The content is not intended to be a personal recommendation to buy or sell any financial instrument or product, or to adopt any investment strategy as it is not provided based on an assessment of your investing knowledge and experience, your financial situation or your investment objectives. The value of your investments, and the income derived from them, may go down as well as up. You may not get back all the money that you invest. The investments referred to in this article may not be suitable for all investors, and if in doubt, an investor should seek advice from a qualified investment adviser.
Full performance can be found on the company or index summary page on the interactive investor website. Simply click on the company's or index name highlighted in the article.
Important Information
Kepler Partners is not authorised to make recommendations to Retail Clients. This report is based on factual information only, and is solely for information purposes only and any views contained in it must not be construed as investment or tax advice or a recommendation to buy, sell or take any action in relation to any investment.
This report has been issued by Kepler Partners LLP solely for information purposes only and the views contained in it must not be construed as investment or tax advice or a recommendation to buy, sell or take any action in relation to any investment. If you are unclear about any of the information on this website or its suitability for you, please contact your financial or tax adviser, or an independent financial or tax adviser before making any investment or financial decisions.
The information provided on this website is not intended for distribution to, or use by, any person or entity in any jurisdiction or country where such distribution or use would be contrary to law or regulation or which would subject Kepler Partners LLP to any registration requirement within such jurisdiction or country. Persons who access this information are required to inform themselves and to comply with any such restrictions. In particular, this website is exclusively for non-US Persons. The information in this website is not for distribution to and does not constitute an offer to sell or the solicitation of any offer to buy any securities in the United States of America to or for the benefit of US Persons.
This is a marketing document, should be considered non-independent research and is subject to the rules in COBS 12.3 relating to such research. It has not been prepared in accordance with legal requirements designed to promote the independence of investment research.
No representation or warranty, express or implied, is given by any person as to the accuracy or completeness of the information and no responsibility or liability is accepted for the accuracy or sufficiency of any of the information, for any errors, omissions or misstatements, negligent or otherwise. Any views and opinions, whilst given in good faith, are subject to change without notice.
This is not an official confirmation of terms and is not to be taken as advice to take any action in relation to any investment mentioned herein. Any prices or quotations contained herein are indicative only.
Kepler Partners LLP (including its partners, employees and representatives) or a connected person may have positions in or options on the securities detailed in this report, and may buy, sell or offer to purchase or sell such securities from time to time, but will at all times be subject to restrictions imposed by the firm's internal rules. A copy of the firm's conflict of interest policy is available on request.
Past performance is not necessarily a guide to the future. The value of investments can fall as well as rise and you may get back less than you invested when you decide to sell your investments. It is strongly recommended that Independent financial advice should be taken before entering into any financial transaction.
PLEASE SEE ALSO OUR TERMS AND CONDITIONS
Kepler Partners LLP is a limited liability partnership registered in England and Wales at 9/10 Savile Row, London W1S 3PF with registered number OC334771.
Kepler Partners LLP is authorised and regulated by the Financial Conduct Authority.