Why you should think twice before dashing for cash
War and its impact on interest rates may make cash savings seem appealing. One investment trust analyst calculates why long-term cash holdings carry a cost that’s easy to overlook.
22nd May 2026 14:09

This content is provided by Kepler Trust Intelligence, an investment trust focused website for private and professional investors. Kepler Trust Intelligence is a third-party supplier and not part of interactive investor. It is provided for information only and does not constitute a personal recommendation.
Material produced by Kepler Trust Intelligence should be considered a marketing communication, and is not independent research.
The conflict in the Middle East that began in late February has reintroduced a familiar source of volatility to financial markets and, in doing so, has rewritten the near-term path for UK inflation and interest rates.
Prior to the war, the direction of travel looked relatively clear. According to the global advisory firm Deloitte, in mid-February, inflation was on course to return to its 2.0% target and expectations for the Bank of England (BoE) to cut rates from 3.75% to 3.25% by year’s end.
However, the disruption to the oil supply through the Strait of Hormuz, and now the uneasy ceasefire in the Persian Gulf, changed that narrative quickly. Higher energy prices pushed CPI to 3.3% in March, alongside new BoE forecasts which, in the most severe scenario, estimate inflation peaking as high as 6.2%, if the conflict and its energy price impact persist.
Additionally, rate cuts look unlikely; instead, we’ve already seen one rate pause, and markets are beginning to price in potential hikes. While hikes are not yet a done deal, as the BoE’s governor has already cautioned against strong conclusions on that front, it’s clear that disruption on this scale creates a more risk-off environment.
Against this backdrop, investors across the board tend to reassess their positioning, and with deposit rates still above 4%, the pull toward cash is entirely understandable. For investors with a longer horizon, however, it may not be the right call.
The role of cash and its limits
Cash has a clear and legitimate role for short-term needs, emergency reserves or as dry powder. The issue that comes to the fore is, in our view, cash becomes a default or reflexive response to uncertainty.
The long-term cost of over-relying on cash is well documented. Drawing on data from Morningstar and the BoE, we can see that a one-off £1,000 investment made in April 1999, the year ISAs launched, would now be worth £6,753 in the average North American fund. Even UK equity funds, despite two decades of market challenges, would have grown that original £1,000 to £4,053. This is over twice what you would have if you had reinvested in the average cash ISA over the same period: £1,948.
Keeping money in cash can feel comfortable, particularly in periods like the present. But for patient investors willing to look through the short-term noise, maintaining exposure to a diversified pool of quality assets through difficult times has historically delivered far more over the long term than cash alone.
That does not mean avoiding cash entirely; it has its place. But equities have a long-run record of delivering both income and capital growth that cash struggles to match, and investment trusts, in our view, are one of the most compelling vehicles through which to access that over the long term.
Why investment trusts?
The closed-ended structure of investment trusts gives them specific advantages that we all know well. One key advantage is that trusts can retain up to 15% of annual income each year, building a revenue reserve that supports continuous dividend growth even through leaner periods. It is a mechanism with no equivalent in the open-ended world, one that has proven crucial in allowing numerous trusts to grow their dividends every year for decades, through recessions, financial crises, multiple wars and a pandemic that saw swathes of FTSE companies cut or suspend payments entirely.
The AIC’s Dividend Heroes list is the most tangible evidence of what that advantage produces. Currently, 21 trusts qualify, having increased their annual dividend for at least 20 consecutive years, with 10 of them doing so for more than half a century. Yields vary from under 1% to above 5%, and dividend growth rates vary considerably too, and it is the growth rate, not the headline yield, that is the critical metric here. Cash rates are currently above inflation, but that is a function of an unusually elevated rate environment, not a permanent feature. Even so, the dividend growth records of these trusts, by contrast, have delivered higher growth, also above inflation, across every kind of rate environment over decades. A trust growing its dividend at 4% per annum does not necessarily need the MPC to cooperate. Cash does.
Not every Hero is an income vehicle, though. Scottish Mortgage Ord, for instance, has an unbroken record stretching back 43 years but only yields 0.37%, making it primarily a capital growth vehicle. The income story sits predominantly in the equity income sectors, notably the UK. Within this sector, six trusts featured on the Dividend Heroes list currently yield above the BoE’s base rate of 3.75%, with an average yield of approximately 4.5%, broadly in line with the best fixed-rate cash ISA available today, according to Moneyfacts. On a headline basis, the numbers look similar. But that comparison only holds if you treat income as a static thing.
The table below puts that argument in pounds and pence. For investors tempted by the 4.5% cash ISA, the income columns show a comparison of what a £10,000 investment in each trust would actually pay in years one, five and 10, based on its current yield grown forward at its historic five-year dividend growth rate.
To begin with, neither trust income nor cash interest is assumed to be reinvested, isolating the income growth story cleanly. This represents what the investor drawing down their income would receive if this historic dividend growth were repeated. The cash rate is held flat at 4.5% throughout, which we think is a generous assumption. It is, of course, possible that cash rates could rise, but looking at current market expectations for interest rates, even after the outbreak of war, the expectation is for a couple of modest hikes to the base rate and then a resumption of a decline.
Of course, there are lots of assumptions being made here, but we think this is a useful exercise. The income delivered by most trusts starts close to cash in year one, but the dividend growth rate does its work steadily, and by year 10, every trust on the list is paying materially more in annual income than cash.
UK EQUITY INCOME COMPARISON
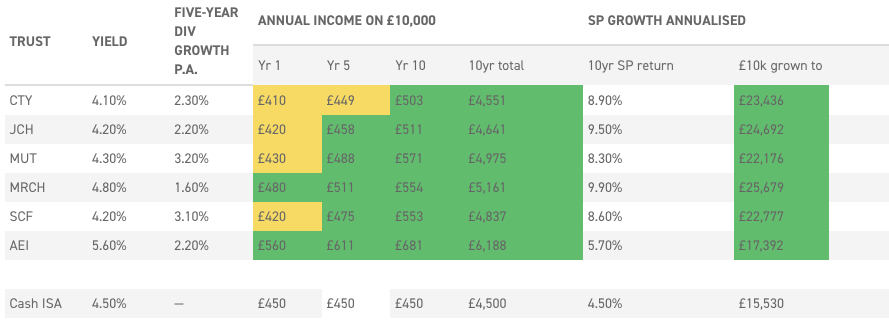
Source: AIC, Kepler calculations. Data as at 12/05/2026. Income projections are based on current yield grown at each trust's historic five-year dividend growth rate on a fixed £10,000 investment, with income not reinvested. Capital figures reflect historic 10-year annualised share price total return, with dividends reinvested. Cash ISA rate held flat for illustrative purposes. Past performance is not a reliable indicator of future results
The income story alone makes a clear case. But investment trusts are not simply income vehicles; they are actively managed equity portfolios with a long track record of capital growth alongside that rising income, and many investors like to grow their capital by reinvesting dividends to benefit from the magic of compounding. The right-hand columns illustrate what £10,000 has grown to over the past decade on a total return basis, meaning with dividends reinvested. Of course, past performance is not a reliable guide to future performance, and the next decade may deliver very different returns from the past one. Cash rates, dividend growth rates and capital returns can all look very different across different market cycles. However, we think this illustrates the potential in equity income for growth investors, and it’s worth remembering the past decade includes the impact of the Brexit vote, the pandemic and the 2022 spike in inflation, yet UK equity income has delivered strong absolute returns.
What the data shows is the kind of growth these trusts have historically delivered alongside their income, and the gap that has opened up versus cash over a meaningful time horizon. A £10,000 investment in Merchants Trust (MRCH) ten years ago, for example, with dividends reinvested, would have grown to £25,679 on that basis, against £11,971 if it had been reinvested in the average cash ISA for the past ten years. It’s also better than the £15,530 that would have been achieved at the much higher current rate of 4.5% compounded. Overall, it’s that combination of growing income and capital return potential that makes the strong case for equity income investment trusts, in our view.
The equity income heroes in focus
The data in the table above makes the income growth argument clear enough. But behind those numbers sit specific track records. City of London Ord is approaching a landmark that puts the compounding argument in its sharpest relief: the potential delivery of its 60th consecutive year of dividend growth, a record unmatched in the investment trust sector. That consistency has not been achieved by accident.
Manager Job Curtis constructs the portfolio with deliberate balance, combining higher-yielding stocks with companies capable of delivering stronger long-term dividend and capital growth, diversifying the income pool in a way that smooths earnings over time. The trust's revenue reserves have provided an additional buffer during lean periods, most recently during the pandemic, when many UK companies cut or suspended dividends entirely and open-ended equity income funds were forced to reduce distributions. CTY maintained and grew its dividend over this period, as the chart below illustrates. Notably, the board has also maintained a traditional approach to dividend policy. Where others in the sector have adopted enhanced dividend policies, CTY emphasises that payments are expected to come from revenue rather than realised capital gains. This can be really important in weaker markets, when investors are seldom keen to receive income funded by their own capital.
DPS & RPS
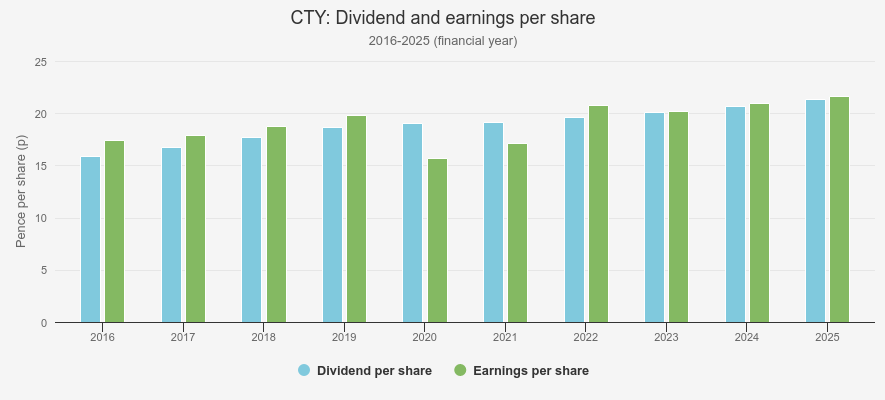
Source: Janus Henderson Investors
Another strong contender is JPMorgan Claverhouse Ord, which has achieved 53 consecutive years of dividend growth. The trust has a distinctive characteristic that sets it apart from many of its UK equity income peers: it invests solely in UK-listed equities, without the overseas allocation that most of its sector peers carry. That focus is a deliberate choice, with the management trio – Anthony Lynch, Callum Abbott and Katen Patel – seeing great opportunity and value on home soil.
The managers have evolved the portfolio meaningfully in recent years, adopting a more blended approach that combines higher-yielding stocks with quality compounders, whilst reducing exposure to utilities and miners in favour of mid-cap opportunities, where the balance between yield and growth potential can be more favourable than in parts of the large-cap market. That broadening of income and capital sources, combined with a 53-year dividend growth record, makes JCH a compelling choice for an attractive income but also a play on recovery for UK domestics.
Another UK equity income stalwart is Schroder Income Growth Ord, which has compounded its dividend at 4.1% annually since 1996, against inflation of 2.5%, providing investors real income growth across three decades and multiple cycles. The board has signalled its intention to pursue a 31st consecutive year of growth, supported by a diversified, dividend-generating portfolio and healthy distributable reserves. Manager Sue Noffke believes the portfolio is well placed from here: elevated buyback activity has strengthened dividend cover materially, and as larger UK companies approach peak repurchase activity, buybacks look set to continue among smaller and mid-sized companies, an area SCF is well represented. Additionally, Sue argues that valuations here remain undemanding and dividend growth potential looks strong compared to large-caps. At a current 7.6% discount, wider than its five-year average of 5.5%, SCF presents an opportunity for investors to get access to an above-market yield, backed by a 30-year growth record alongside capital growth potential.
DISCOUNT
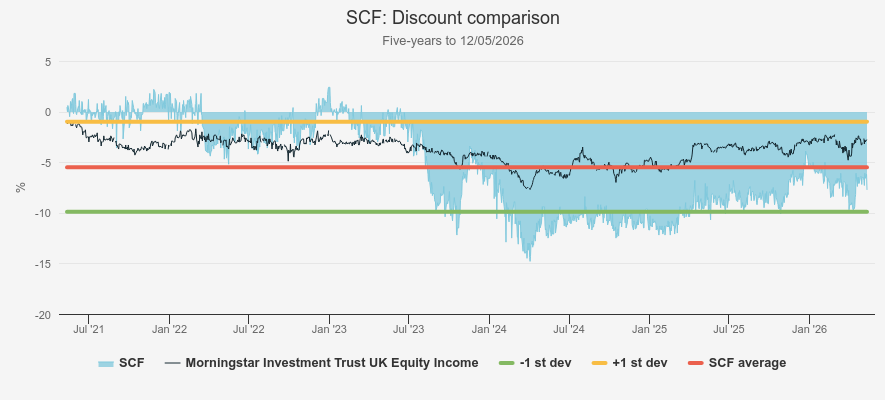
Source: Morningstar
The dividend growth story does not end at the UK border.Scottish American Ord makes the global dimension of the argument explicit. Managed by Baillie Gifford, the trust has grown its dividend for 52 consecutive years, with total payouts rising 7% in the most recent year, more than double the UK inflation rate over the same period. The long-run numbers are equally compelling: since 1938, SAINTS has grown its dividend per share at 8% per annum against UK CPI of 5%, and since Baillie Gifford took over management in 2003, at 5% per annum against inflation of 2%. That consistent 3% annual margin above inflation, sustained across very different economic and market environments, is precisely the trajectory that a cash account cannot replicate. The trust’s approach centres on identifying companies with both dependable dividends and earnings growth to sustain them, a deliberately global opportunity set that produces a portfolio very different from conventional equity indices, where income is often dominated by a small number of cyclical, capital-intensive businesses.
Dividend cultures across Asia have also evolved considerably over the past decade, driven by corporate governance reform in Japan, rising payout ratios across Korea and China, alongside a growing focus on shareholder returns across the region more broadly. For investors seeking to diversify income growth potential beyond UK and global equity income strategies,Schroder Oriental Income OrdandHenderson Far East Income Ordoffer ways to access that evolution.
SOI has grown its dividend for 19 consecutive years, one year from full Dividend Hero status, and would, if achieved, become the first Asia-focussed trust to carry the accolade. Manager Richard Sennitt runs a pure natural income strategy, focussing on companies paying attractive or growing dividends rather than relying on enhanced dividend policies or capital contributions, a profile that is increasingly differentiated as peers have moved away from traditional equity income approaches. SOI’s current discount of 6.3%, wider than its five-year average of 5.0%, increases the entry yield to approximately 4.3%, alongside the opportunity for discounted exposure to the structural growth characteristics of the Asian region. For investors already anchored in UK equity income, SOI offers a natural complement, diversifying both capital and income growth drivers at a valuation that appears somewhat disconnected when considering its long-run income and capital growth delivery.
HFEL takes a different approach but arrives at a similarly compelling income proposition. With a yield approaching 10% and annualised dividend growth of approximately 4.5% since 2007, ahead of its regional benchmark’s CAGR of around 3.3%, the trust has grown its dividend for 18 consecutive years, putting it two years from full Dividend Hero status. If achieved, it would be the highest-yielding trust on the list by a significant margin. Importantly, though, the income is well supported: around two-thirds is generated by underlying portfolio dividends, with the remainder supplemented by a disciplined options overlay strategy that has proven particularly effective in the elevated volatility of recent months. Revenue reserves are also healthy, and the board has clear capacity to continue raising the dividend. Blending income with increasing capital discipline and a structural underweight to technology, HFEL offers a genuinely differentiated income option, but also a way to access Asian equities.
HFEL DIVIDEND GROWTH
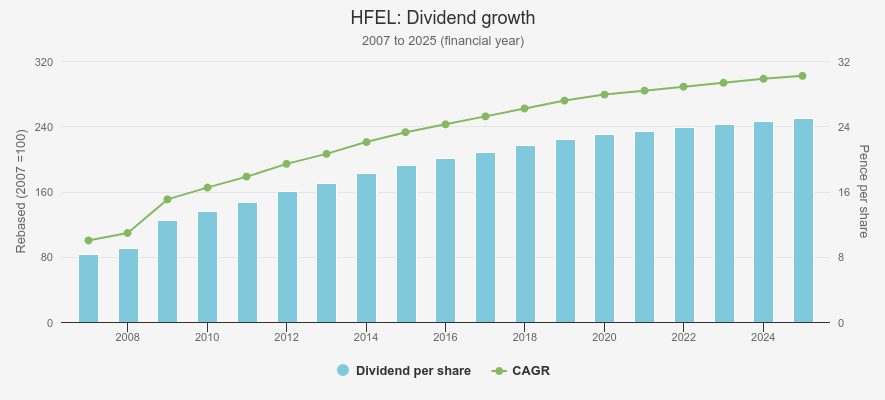
Source: Morningstar
Final thoughts
Cash has a role, and in the current environment, its appeal is rational. We are not arguing against that. What this piece has tried to show is that the instinct to default to cash, particularly when uncertainty is elevated and deposit rates are attractive, carries a cost that is easy to overlook in the moment. That cost is dividend growth.
The trusts discussed here have compounded their income year after year, through inflationary shocks, recessions, financial crises and multiple periods of geopolitical disruption, supported by the unique structure of investment trusts not available through cash. Yes, cash ISA rates of 4.5% look compelling today. But in five or 10 years’ time, when those rates have moved on, and the dividend growth records of these trusts have continued to compound, the opportunity cost of staying in cash will be considerably clearer.
For patient investors, that above-inflation growing income stream, combined with the potential for long-term capital growth, is something a savings account simply hasn’t matched, making it potentially too costly to ignore.
Kepler Partners is a third-party supplier and not part of interactive investor. Neither Kepler Partners or interactive investor will be responsible for any losses that may be incurred as a result of a trading idea.
These articles are provided for information purposes only. Occasionally, an opinion about whether to buy or sell a specific investment may be provided by third parties. The content is not intended to be a personal recommendation to buy or sell any financial instrument or product, or to adopt any investment strategy as it is not provided based on an assessment of your investing knowledge and experience, your financial situation or your investment objectives. The value of your investments, and the income derived from them, may go down as well as up. You may not get back all the money that you invest. The investments referred to in this article may not be suitable for all investors, and if in doubt, an investor should seek advice from a qualified investment adviser.
Full performance can be found on the company or index summary page on the interactive investor website. Simply click on the company's or index name highlighted in the article.
Important Information
Kepler Partners is not authorised to make recommendations to Retail Clients. This report is based on factual information only, and is solely for information purposes only and any views contained in it must not be construed as investment or tax advice or a recommendation to buy, sell or take any action in relation to any investment.
This report has been issued by Kepler Partners LLP solely for information purposes only and the views contained in it must not be construed as investment or tax advice or a recommendation to buy, sell or take any action in relation to any investment. If you are unclear about any of the information on this website or its suitability for you, please contact your financial or tax adviser, or an independent financial or tax adviser before making any investment or financial decisions.
The information provided on this website is not intended for distribution to, or use by, any person or entity in any jurisdiction or country where such distribution or use would be contrary to law or regulation or which would subject Kepler Partners LLP to any registration requirement within such jurisdiction or country. Persons who access this information are required to inform themselves and to comply with any such restrictions. In particular, this website is exclusively for non-US Persons. The information in this website is not for distribution to and does not constitute an offer to sell or the solicitation of any offer to buy any securities in the United States of America to or for the benefit of US Persons.
This is a marketing document, should be considered non-independent research and is subject to the rules in COBS 12.3 relating to such research. It has not been prepared in accordance with legal requirements designed to promote the independence of investment research.
No representation or warranty, express or implied, is given by any person as to the accuracy or completeness of the information and no responsibility or liability is accepted for the accuracy or sufficiency of any of the information, for any errors, omissions or misstatements, negligent or otherwise. Any views and opinions, whilst given in good faith, are subject to change without notice.
This is not an official confirmation of terms and is not to be taken as advice to take any action in relation to any investment mentioned herein. Any prices or quotations contained herein are indicative only.
Kepler Partners LLP (including its partners, employees and representatives) or a connected person may have positions in or options on the securities detailed in this report, and may buy, sell or offer to purchase or sell such securities from time to time, but will at all times be subject to restrictions imposed by the firm's internal rules. A copy of the firm's conflict of interest policy is available on request.
Past performance is not necessarily a guide to the future. The value of investments can fall as well as rise and you may get back less than you invested when you decide to sell your investments. It is strongly recommended that Independent financial advice should be taken before entering into any financial transaction.
PLEASE SEE ALSO OUR TERMS AND CONDITIONS
Kepler Partners LLP is a limited liability partnership registered in England and Wales at 9/10 Savile Row, London W1S 3PF with registered number OC334771.
Kepler Partners LLP is authorised and regulated by the Financial Conduct Authority.