eyeQ: Fed decision is chance to buy this bank stock
Experts at eyeQ use AI and their own smart machine to analyse macro conditions and generate actionable trading signals. Here, it’s triggered a bullish signal on a financial giant.
17th September 2026 11:40
by Huw Roberts from eyeQ

“Our signals are crafted through macro-valuation, trend analysis, and meticulous back-testing. This combination ensures a comprehensive evaluation of an asset's value, market conditions, and historical performance.” eyeQ
- Discover: eyeQ analysis explained | eyeQ: our smart machine in action | Glossary
Bank of America
Macro Relevance: 73%
Model Value: $64.27
Fair Value Gap: -11.03 discount to model value
Data correct as at 17 September 2026. Please click glossary for explanation of terms. Long-term strategic model.
After last night's Federal Reserve interest rate hike, Financials were the second worst performing US equity sector, falling 1.6%.
There is a truism in investing that banks like rising rates and steeper yield curves. Bear flattening of the yield curve (when short-dated yields like 2-years rise more than long-dated yields like 10-years) is their kryptonite.
Why? Because higher rates and steeper yield curves mean banks can earn a bigger spread between what they pay depositors and what they charge borrowers.
So, it's interesting then that eyeQ's smart machine has just fired a new bullish signal on Bank of America Corp (NYSE:BAC). The stock itself reacted poorly to the Fed's rate hike decision and is now down nearly 10% since the mid-August highs.
In contrast, eyeQ model value has risen almost 3% in the last month. This is not to negate the idea that the yield curve rule-of-thumb is wrong. But more that other macro forces are more than offsetting. Currently, our model shows the biggest positive driver of BAC is real yields. And the recent rise in real yields is helping cushion the impact from the yield curve.
This is why macro is often so tricky to follow (so many moving parts) but is a good example of how eyeQ's AI-driven process can help investors. Right now, eyeQ argues there's decent risk-reward on using this pullback in Bank of America as an opportunity.
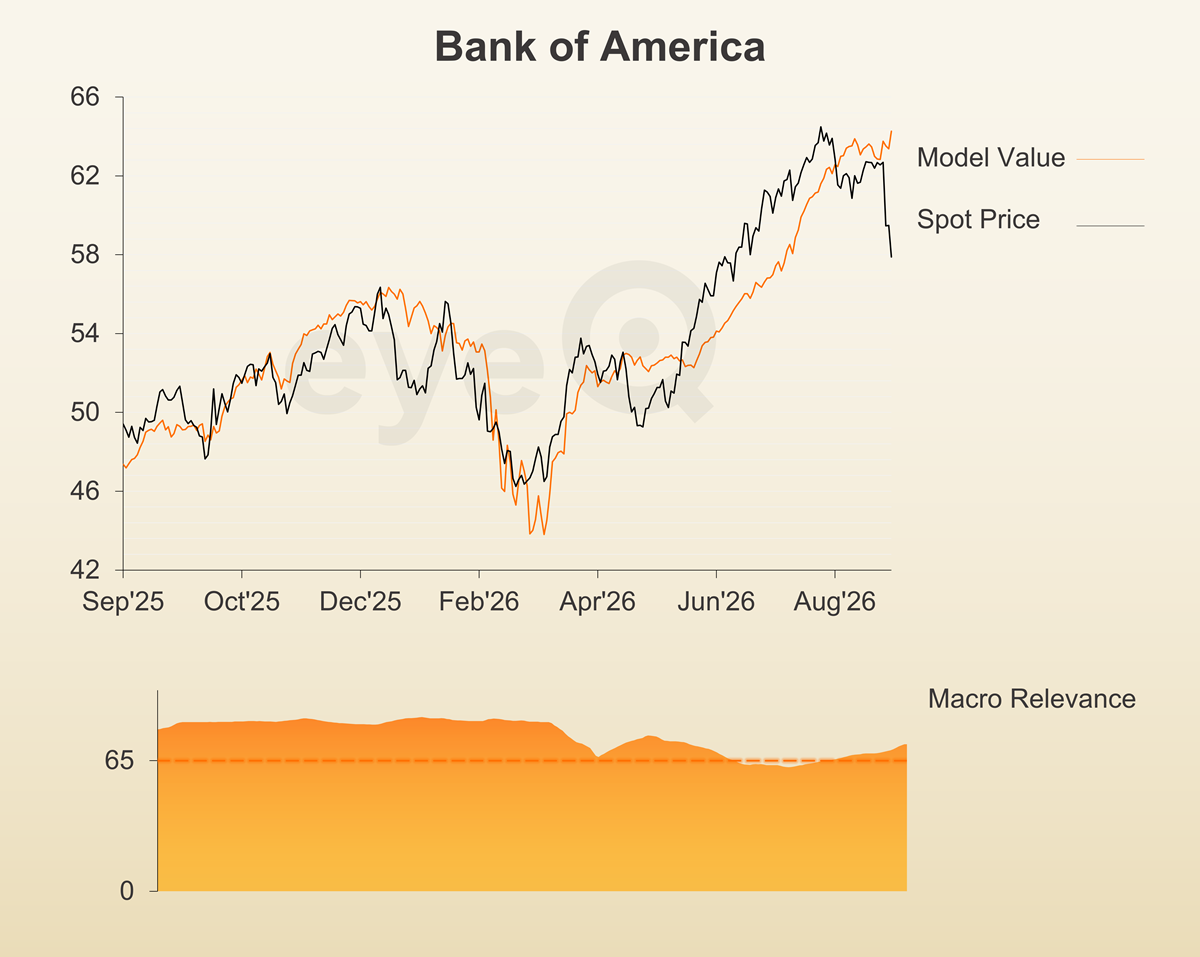
Source: eyeQ. Past performance is not a guide to future performance.
Useful terminology:
Model value
Where our smart machine calculates that any stock market index, single stock or exchange-traded fund (ETF) should be priced (the fair value) given the overall macroeconomic environment.
Model (macro) relevance
How confident we are in the model value. The higher the number the better! Above 65% means the macro environment is critical, so any valuation signals carry strong weight. Below 65%, we deem that something other than macro is driving the price.
Fair Value Gap (FVG)
The difference between our model value (fair value) and where the price currently is. A positive Fair Value Gap means the security is above the model value, which we refer to as “rich”. A negative FVG means that it's cheap. The bigger the FVG, the bigger the dislocation and therefore a better entry level for trades.
Long Term model
This model looks at share prices over the last 12 months, captures the company’s relationship with growth, inflation, currency shifts, central bank policy etc and calculates our key results - model value, model relevance, Fair Value Gap.
These third-party research articles are provided by eyeQ (Quant Insight). interactive investor does not make any representation as to the completeness, accuracy or timeliness of the information provided, nor do we accept any liability for any losses, costs, liabilities or expenses that may arise directly or indirectly from your use of, or reliance on, the information (except where we have acted negligently, fraudulently or in wilful default in relation to the production or distribution of the information).
The value of your investments may go down as well as up. You may not get back all the money that you invest.
Equity research is provided for information purposes only. Neither eyeQ (Quant Insight) nor interactive investor have considered your personal circumstances, and the information provided should not be considered a personal recommendation. If you are in any doubt as to the action you should take, please consult an authorised financial adviser.
Disclosure
We use a combination of fundamental and technical analysis in forming our view as to the valuation and prospects of an investment. Where relevant we have set out those particular matters we think are important in the above article, but further detail can be found here.
Please note that our article on this investment should not be considered to be a regular publication.
Details of all recommendations issued by ii during the previous 12-month period can be found here.
ii adheres to a strict code of conduct. Contributors may hold shares or have other interests in companies included in these portfolios, which could create a conflict of interests. Contributors intending to write about any financial instruments in which they have an interest are required to disclose such interest to ii and in the article itself. ii will at all times consider whether such interest impairs the objectivity of the recommendation.
In addition, individuals involved in the production of investment articles are subject to a personal account dealing restriction, which prevents them from placing a transaction in the specified instrument(s) for a period before and for five working days after such publication. This is to avoid personal interests conflicting with the interests of the recipients of those investment articles.