A FTSE 100 stock to watch plus a trade secret
Independent analyst Alistair Strang is watching the price action and waiting to see if this blue-chip can deliver a recovery signal.
29th October 2026 07:34
by Alistair Strang from Trends and Targets

If you've had enough of the Budget, perhaps it’s more interesting if we turn our attention to something we regard as one of our trade secrets.
- Invest with ii:Open a Stocks & Shares ISA | Top ISA Funds | Transfer your ISA to ii
The significance of a broken uptrend
One technical pattern we keep a particularly close eye on occurs when an established uptrend breaks, only for the share price to return and repeatedly challenge the former trendline.
In our experience, this can be a useful early indication that a recovery may be brewing, although patience is often required. It’s certainly not an automatic buy signal, but it can provide a compelling reason to watch a share more closely.
The converse can also apply when a downtrend breaks. However, our particular interest here is the recovery potential that can emerge after a share price breaks below an established red uptrend and subsequently attempts to reclaim it.
The important point is what happens next. A sustained move back above the broken trendline can represent a meaningful change in market sentiment, potentially opening the door to some substantial share price movement.
Of course, nothing on the stock market is a certainty. But this is precisely the sort of technical development that, in our view, deserves attention.
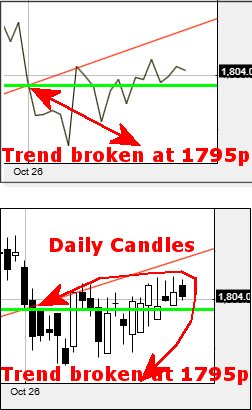
Source: Trends and Targets. Past performance is not a guide to future performance.
ICG: the recovery levels to watch
The accompanying chart extracts illustrate what has been happening since alternative asset manager ICG (LSE:ICG)’s share price broke below the red uptrend at approximately 1,795p.
Since that break, the price has exceeded the original break level on several occasions. The next development we’re watching for is a convincing recovery above the red uptrend itself, which currently sits at approximately 1,847p.
Why does this matter?
A successful reclaiming of a broken uptrend can be a significant positive signal. It suggests that selling pressure may be easing and that buyers could be regaining control. Should ICG push convincingly above the current trendline, a recovery could develop more quickly than some investors might expect.
That’s the opportunity we’re watching for. It’s a case of watch and wait, rather than assuming the recovery has already arrived.
The bullish scenario
If our optimistic interpretation proves correct, a move above 1,817p could be an early trigger for further gains, initially towards 1,961p.
Should that level subsequently be exceeded, our longer-term secondary objective comes in at approximately 2,083p.
We’ve also pencilled in several additional potential levels on the charts. Not every projection will necessarily prove relevant, of course, but the overall technical picture provides some interesting possibilities should the recovery gather momentum.
The key distinction is between an initial improvement in the share price and a genuine recovery of the broken red uptrend. The latter, currently around 1,847p, would provide the more compelling confirmation of our bullish thesis.
The bearish alternative
Naturally, markets have a habit of making traders look foolish, often at considerable expense.
Should ICG fall below 1,733p, the picture could deteriorate, with an initial downside objective around 1,676p.
If that level were subsequently breached, our secondary downside projection would be approximately 1,546p.
That last figure might look improbable at present, but technical projections are conditional, not predictions carved in stone. A move towards it would require further weakness and confirmation along the way.
For now, it remains our alternative scenario rather than our preferred outcome.
Our verdict
We’re leaning towards optimism on ICG, but we’re not confusing optimism with confirmation.
The levels are clear enough: 1,817p is the potential initial bullish trigger, 1,847p is the red uptrend recovery level to watch, and 1,961p, followed by 2,083p represents the upside potential should momentum develop.
On the downside, a break below 1,733p would weaken the picture and bring 1,676p into focus, with 1,546p as a more distant secondary possibility.
As ever, there are no guarantees in the stock market. We’ll be watching the price action and waiting to see whether ICG can deliver the recovery signal we’re hoping for.
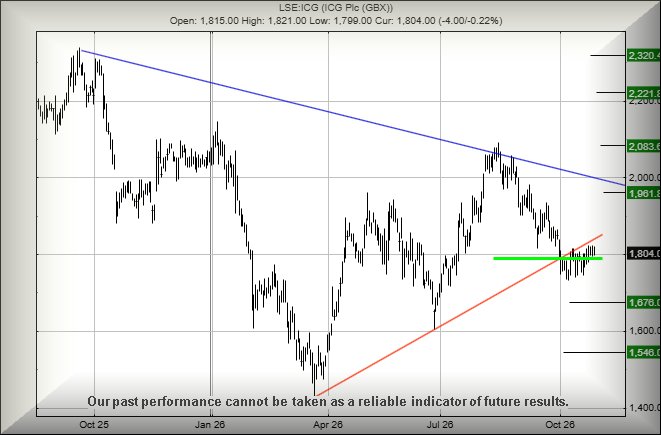
Source: Trends and Targets. Past performance is not a guide to future performance.
Alistair Strang has led high-profile and "top secret" software projects since the late 1970s and won the original John Logie Baird Award for inventors and innovators. After the financial crash, he wanted to know "how it worked" with a view to mimicking existing trading formulas and predicting what was coming next. His results speak for themselves as he continually refines the methodology.
Alistair Strang is a freelance contributor and not a direct employee of Interactive Investor. All correspondence is with Alistair Strang, who for these purposes is deemed a third-party supplier. Buying, selling and investing in shares is not without risk. Market and company movement will affect your performance and you may get back less than you invest. Neither Alistair Strang or Interactive Investor will be responsible for any losses that may be incurred as a result of following a trading idea.
These articles are provided for information purposes only. Occasionally, an opinion about whether to buy or sell a specific investment may be provided by third parties. The content is not intended to be a personal recommendation to buy or sell any financial instrument or product, or to adopt any investment strategy as it is not provided based on an assessment of your investing knowledge and experience, your financial situation or your investment objectives. The value of your investments, and the income derived from them, may go down as well as up. You may not get back all the money that you invest. The investments referred to in this article may not be suitable for all investors, and if in doubt, an investor should seek advice from a qualified investment adviser.
Full performance can be found on the company or index summary page on the interactive investor website. Simply click on the company's or index name highlighted in the article.