FTSE for Friday: the gold standard of chart signals
Using his favourite rule of thumb, independent analyst Alistair Strang studies the FTSE 100's recent intraday record high and what it suggests might happen next.
31st July 2026 07:35
by Alistair Strang from Trends and Targets

Our “higher highs” rule can sometimes seem a little confusing. The FTSE 100 is currently being celebrated across the financial media after setting a new intraday all-time high of 10,979.80 points. It sounds impressive, eclipsing February’s previous intraday peak of 10,934 points. Should we be overflowing with optimism?
Actually no, we’re not willing to abandon caution.
- Invest with ii:Open a Stocks & Shares ISA | Top ISA Funds | Transfer your ISA to ii
This is due to our favourite rule of thumb, that the closing price matters far more than the intraday high. Thus, on 27 February, the FTSE 100 closed the session at 10,910 points. And on Wednesday this week, it closed at 10,908 points, with Thursday 30 July closing the day at 10,897 points.
This creates a seriously confusing scenario, where an all-time high made itself known on the same day that the FTSE recorded another “lower low” in its history of closing prices. This is – from our perspective – the gold standard of chart signals. The FTSE desperately needed to close above 10,910 points from February, yet the highest closing price achieved in July has been 10,908 points.
We regard this as quite a big deal, an important box remaining unchecked and leaving us poised to take a negative stance on what’s coming next for the UK market. The good news is we appear to be witnessing the formation of a glass ceiling – or flat trend as we call it – one of these things where future closure above the ceiling (10,910 points) shall almost certainly bring strong upward index movements. Until such an event, our inclination is to regard the record high as a fake feint by the market, perhaps designed to make traders abandon short positions in despair!
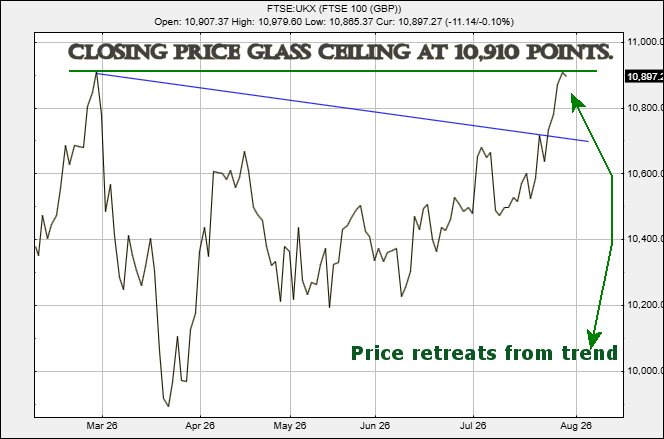
Source: Trends and Targets. Past performance is not a guide to future performance.
From a near-term perspective, we shall be fascinated if the FTSE 100 manages below 10,865 points as this risks triggering reversals to an initial 10,830 points with our secondary, if broken, at a less comfortable 10,748 points. If triggered, the tightest stop loss level works out at 10,915 points.
This secondary target of 10,748 would ideally be one of these strange “backtests”, when the index chooses to challenge the point at which the breakout above blue occurred. Should this be the case, it will indeed be reasonable to anticipate a bounce from the 10,748 level. A major issue does exist at such a point, due to movement below 10,748 risking a drop of a further 180 points, taking the FTSE below blue and utterly fouling optimism for the future.
The above negative scenario also gives “the market” the opportunity to park the FTSE for August, giving a “safe” trading range between 10,750 and the 11,000 point level. This would make sense, creating a nursery while the grown-ups all head to Butlins for a month.
The bullish alternative
Naturally, there’s a positive scenario as well.
A move above 10,980 points should trigger an initial target around 11,089 points. If that level is overcome, our secondary objective becomes 11,166 points. Beyond that, we’d expect the longer-term influence of 11,438 to begin asserting itself.
Have a good weekend.
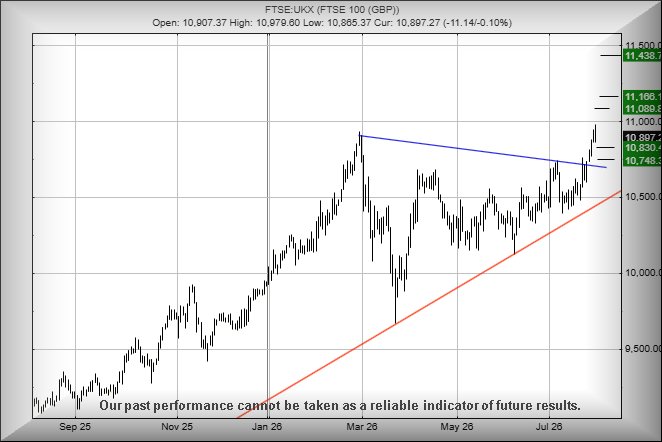
Source: Trends and Targets. Past performance is not a guide to future performance.
Alistair Strang has led high-profile and "top secret" software projects since the late 1970s and won the original John Logie Baird Award for inventors and innovators. After the financial crash, he wanted to know "how it worked" with a view to mimicking existing trading formulas and predicting what was coming next. His results speak for themselves as he continually refines the methodology.
Alistair Strang is a freelance contributor and not a direct employee of Interactive Investor. All correspondence is with Alistair Strang, who for these purposes is deemed a third-party supplier. Buying, selling and investing in shares is not without risk. Market and company movement will affect your performance and you may get back less than you invest. Neither Alistair Strang or Interactive Investor will be responsible for any losses that may be incurred as a result of following a trading idea.
These articles are provided for information purposes only. Occasionally, an opinion about whether to buy or sell a specific investment may be provided by third parties. The content is not intended to be a personal recommendation to buy or sell any financial instrument or product, or to adopt any investment strategy as it is not provided based on an assessment of your investing knowledge and experience, your financial situation or your investment objectives. The value of your investments, and the income derived from them, may go down as well as up. You may not get back all the money that you invest. The investments referred to in this article may not be suitable for all investors, and if in doubt, an investor should seek advice from a qualified investment adviser.
Full performance can be found on the company or index summary page on the interactive investor website. Simply click on the company's or index name highlighted in the article.