FTSE for Friday: a holiday high for the premier index?
Independent analyst Alistair Strang examines a long-term trend before zooming in to consider current potentials.
21st August 2026 09:18
by Alistair Strang from Trends and Targets

We are often reminded of how important it is to zoom out and review things from a big-picture perspective.
- Invest with ii: Open a Stocks & Shares ISA | Top ISA Funds | Transfer your ISA to ii
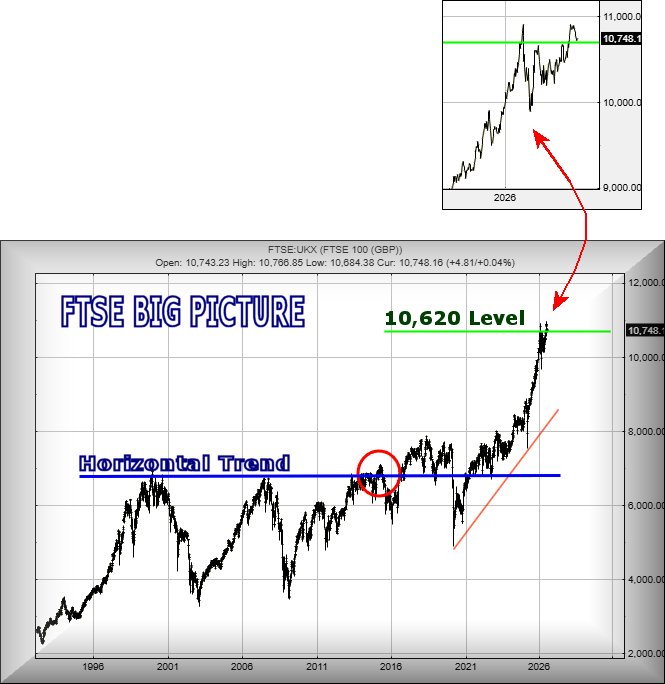
The FTSE 100 is now displaying one of our favourite “charty” examples, with the market creating a very visible horizontal trend since 1999.
What’s quite interesting from the FTSE example is what occurred in 2015 (circled), the market proving that the horizontal trend could be exceeded, giving (from our perspective) a pretty reliable signal that things could become useful.
By June 2015, it almost felt like the index had realised what was about to happen, introducing a panic reversal which didn’t last. In early 2016, the market once again exceeded the blue horizontal trend, achieving a higher high.
For a few years, things looked quite jolly until 2020 and the artificial market drops introduced by Covid-19. But by 2022, once again the FTSE was enjoying higher highs and this time, the index has simply kept going.
What has surprised us - quite a lot - comes from our core big-picture logic, a series of arguments that present 10,620 as a “maximum top”, the price level beyond which we are not supposed to be able to calculate.
As the zoomed-in chart extract below highlights, our theoretical 10,620 looks like the calculation was probably correct, the index value spending this year bouncing around at the target level, even managing to close above it a few times.
This looks significant, indicating that the index is liable to continue heading upwards at some point.
Source: Trends and Targets. Past performance is not a guide to future performance.
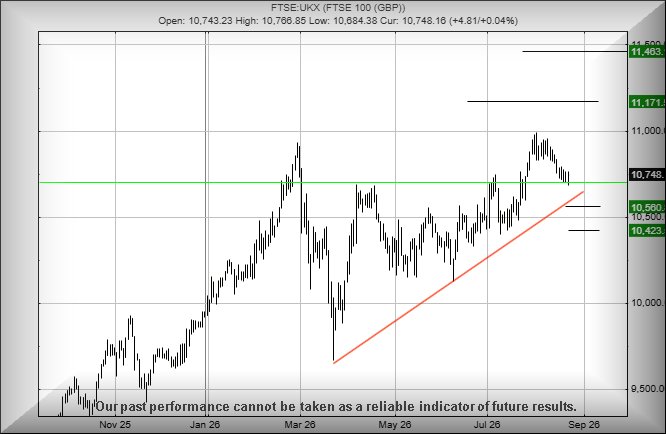
This is one of these things you may wish to print out and save. Should the FTSE continue adhering to our arithmetic rules established since 2015, it is now the case where movement above 10,904 points should trigger further growth to 11,171 points with our secondary, if beaten, at another “top”, which now works out at 11,463 points. If this scenario triggers, the tightest stop loss level calculates at 10,800 points.
Of course, we can throw in an alternative scenario if any attempt is made to slow down the growth cycle.
As a result, if the index drops below 10,670 points, it risks triggering reversal down to an initial 10,560 points with our secondary, if broken, at 10,423 points and, visually, a strong potential for a bounce.
Perhaps this will play out during the next couple of weeks until the grown-ups return from their holidays by the second week of September, after which things tend to pick up again.
Source: Trends and Targets. Past performance is not a guide to future performance.
Alistair Strang has led high-profile and "top secret" software projects since the late 1970s and won the original John Logie Baird Award for inventors and innovators. After the financial crash, he wanted to know "how it worked" with a view to mimicking existing trading formulas and predicting what was coming next. His results speak for themselves as he continually refines the methodology.
Alistair Strang is a freelance contributor and not a direct employee of Interactive Investor. All correspondence is with Alistair Strang, who for these purposes is deemed a third-party supplier. Buying, selling and investing in shares is not without risk. Market and company movement will affect your performance and you may get back less than you invest. Neither Alistair Strang or Interactive Investor will be responsible for any losses that may be incurred as a result of following a trading idea.
These articles are provided for information purposes only. Occasionally, an opinion about whether to buy or sell a specific investment may be provided by third parties. The content is not intended to be a personal recommendation to buy or sell any financial instrument or product, or to adopt any investment strategy as it is not provided based on an assessment of your investing knowledge and experience, your financial situation or your investment objectives. The value of your investments, and the income derived from them, may go down as well as up. You may not get back all the money that you invest. The investments referred to in this article may not be suitable for all investors, and if in doubt, an investor should seek advice from a qualified investment adviser.
Full performance can be found on the company or index summary page on the interactive investor website. Simply click on the company's or index name highlighted in the article.