FTSE for Friday: will UK catch America's cold?
After a spectacular tech crash followed midterm elections, independent analyst Alistair Strang shares key trigger levels for both Wall Street and the FTSE 100.
6th November 2026 07:25
by Alistair Strang from Trends and Targets

The first volley of shots from the USA appear to have impacted the markets, the S&P down 4.36% and Wall Street down 3.44%. It was not a great day, the markets perhaps wondering if they’re about to retreat into the malaise of the President Biden years.
- Invest with ii:Open a Stocks & Shares ISA | Top ISA Funds | Transfer your ISA to ii
From a relatively-near term viewpoint, the Dow Jones apparently only needs weakness below 51,480 points to trigger reversal down to an initial 50,701 points with our secondary, if broken, a less visually likely 49,704 points. If triggered, the index needs exceed 51,905 to cancel the reversal potentials.
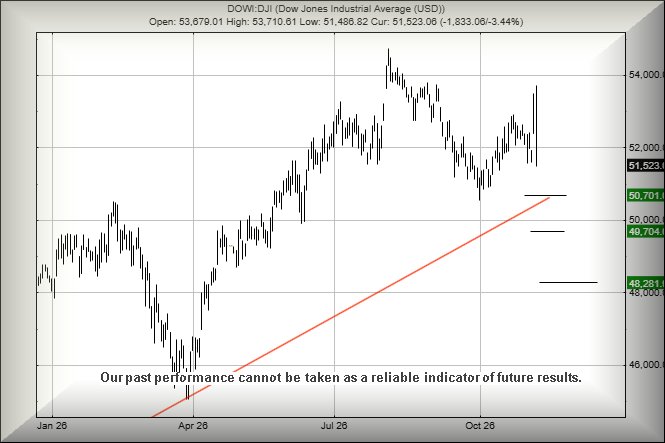
Source: Trends and Targets. Past performance is not a guide to future performance.
As for the UK FTSE 100, ending Thursday “only” down 0.43%, it feels like more trouble may be ahead. We strongly anticipate the FTSE opening substantially down on Friday, roughly 100 points below Thursday's closing price of 10,782 points. Our rather worrying calculations currently produce some dodgy sounding numbers.
Our negative FTSE scenario
If the FTSE 100 manages to open Friday below 10,688 points, serious trouble may be ahead as a cycle down to an initial 10,572 calculates as possible. Our longer-term secondary (or later in the day) works out at 10,449 points, firmly placing the UK index in a zone where an ultimate bottom of 9,932 seems to be attractive.
If triggered, the tightest stop looks like 10,770 points. Obviously, quite a lot will depend on the chaos emanating from the USA, but from the feel of things, the UK market feels destined to seek inspiration from America.
Our positive FTSE scenario
Our calculations to identify any “its all been a dreadful mistake” movements currently demand above 10,830 points should trigger pathetic growth to an initial 10,857 points. Our secondary, if exceeded, adds up to a slightly more useful 10,888 points. To be sensible, only if the FTSE clambers above 10,888 points shall we actually believe the reversal cycle may be erased. The visuals suggest this unlikely.
Have a good weekend.
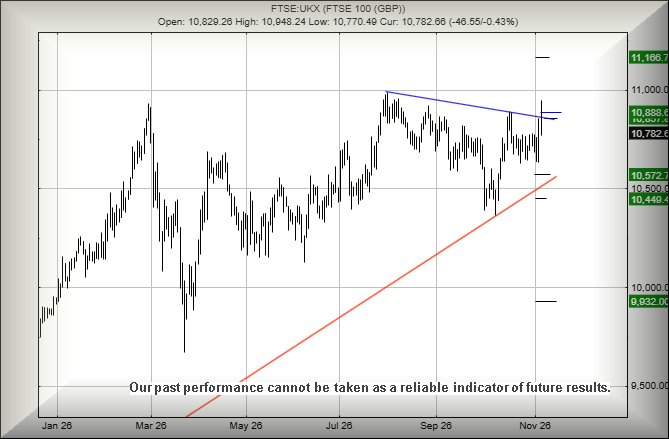
Source: Trends and Targets. Past performance is not a guide to future performance.
Alistair Strang has led high-profile and "top secret" software projects since the late 1970s and won the original John Logie Baird Award for inventors and innovators. After the financial crash, he wanted to know "how it worked" with a view to mimicking existing trading formulas and predicting what was coming next. His results speak for themselves as he continually refines the methodology.
Alistair Strang is a freelance contributor and not a direct employee of Interactive Investor. All correspondence is with Alistair Strang, who for these purposes is deemed a third-party supplier. Buying, selling and investing in shares is not without risk. Market and company movement will affect your performance and you may get back less than you invest. Neither Alistair Strang or Interactive Investor will be responsible for any losses that may be incurred as a result of following a trading idea.
These articles are provided for information purposes only. Occasionally, an opinion about whether to buy or sell a specific investment may be provided by third parties. The content is not intended to be a personal recommendation to buy or sell any financial instrument or product, or to adopt any investment strategy as it is not provided based on an assessment of your investing knowledge and experience, your financial situation or your investment objectives. The value of your investments, and the income derived from them, may go down as well as up. You may not get back all the money that you invest. The investments referred to in this article may not be suitable for all investors, and if in doubt, an investor should seek advice from a qualified investment adviser.
Full performance can be found on the company or index summary page on the interactive investor website. Simply click on the company's or index name highlighted in the article.