A grumble about Barclays' share price
Down 20% from its summer peak to multi-month lows, independent analyst Alistair Strang studies his charts for clues about the outlook for the high street bank.
5th October 2026 07:01
by Alistair Strang from Trends and Targets

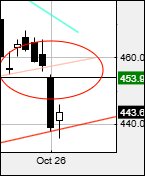
We’re enjoying a little grumble about Barclays (LSE:BARC) share price movements. We’d proposed a “secondary” drop target of 453p when we reviewed the share three weeks ago.
As the chart extract below shows, on 1 October the market chose to manipulate (gap) Barclays' below our 453p when the market woke up, suggesting a new trend has potentially kicked off. From our perspective, this feels like the share price has potential for some unpleasant further failures.
- Invest with ii:Open a Stocks & Shares ISA | Top ISA Funds | Transfer your ISA to ii
Source: Trends and Targets. Past performance is not a guide to future performance. Important: Trends and Targets charts only incorporate official share count consolidations, ignoring rights issues where investors have a choice as to whether to participate.
But on a brighter note – and we’ll come back to this later – share price closure above 458p may now be taken as an extremely positive signal for future growth. Or, alternately, the share price gap above such a level at the open of trade.
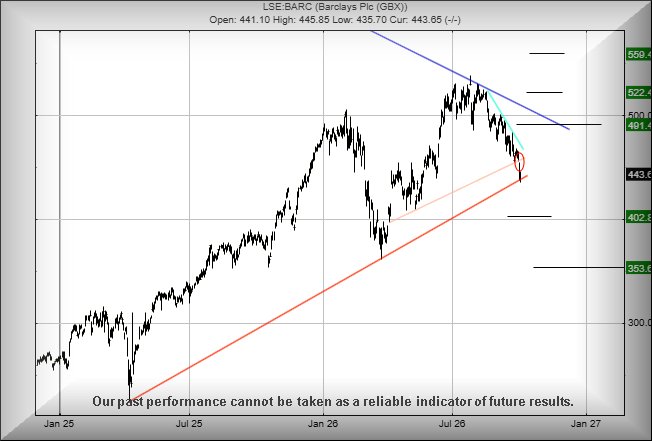
Unfortunately for now, we have little choice but to anticipate the worst, weakness below 435p threatening to trigger reversal to an initial 402p with our secondary, if broken, a more painful 353p.
Our alternate “happy” scenario, if it’s all been a dreadful mistake, suggests above 458p may potentially give the first signal of an error being corrected, calculating with the potential of a lift to an initial 491p with our secondary, if beaten, at 522p.
This secondary target is visually quite pleasing, suggesting a price level where some hesitation should take place despite a third level attraction coming from a distant 559p.
Source: Trends and Targets. Past performance is not a guide to future performance. Important: Trends and Targets charts only incorporate official share count consolidations, ignoring rights issues where investors have a choice as to whether to participate.
Alistair Strang has led high-profile and "top secret" software projects since the late 1970s and won the original John Logie Baird Award for inventors and innovators. After the financial crash, he wanted to know "how it worked" with a view to mimicking existing trading formulas and predicting what was coming next. His results speak for themselves as he continually refines the methodology.
Alistair Strang is a freelance contributor and not a direct employee of Interactive Investor. All correspondence is with Alistair Strang, who for these purposes is deemed a third-party supplier. Buying, selling and investing in shares is not without risk. Market and company movement will affect your performance and you may get back less than you invest. Neither Alistair Strang or Interactive Investor will be responsible for any losses that may be incurred as a result of following a trading idea.
These articles are provided for information purposes only. Occasionally, an opinion about whether to buy or sell a specific investment may be provided by third parties. The content is not intended to be a personal recommendation to buy or sell any financial instrument or product, or to adopt any investment strategy as it is not provided based on an assessment of your investing knowledge and experience, your financial situation or your investment objectives. The value of your investments, and the income derived from them, may go down as well as up. You may not get back all the money that you invest. The investments referred to in this article may not be suitable for all investors, and if in doubt, an investor should seek advice from a qualified investment adviser.
Full performance can be found on the company or index summary page on the interactive investor website. Simply click on the company's or index name highlighted in the article.