Making sense of the trend at this FTSE 100 company
Still within reach of recent highs, independent analyst Alistair Strang explains why this new trend line is so significant for this share.
7th July 2026 07:25
by Alistair Strang from Trends and Targets

We're often asked if we can make sense of a particularly stupid-looking trend, and Investec (LSE:INVP) currently demonstrates how to seek a clear answer. To be blunt, the blue downtrend since 2007 appears to make no sense. Instead, we need to scribble a new line, the light blue trend and things suddenly make a lot of sense.
- Invest with ii:Open a Stocks & Shares ISA | Top ISA Funds | Transfer your ISA to ii
Previously, we'd given a target of 642p, and for just two sessions the share price managed to stumble above our ambitious level.
But a new ball game has commenced, one which suggests movement next above 650p shall exceed the light blue line on the chart extract, suggesting the potential for movement to an impressive future long term 792p with our secondary, if exceeded, calculating at a distant 874p.
Our logic for this series of calculations comes from the visual confirmation the share price has been reacting to light blue, always a problem as the particular indicator rarely jumps out from a chart.
If things intend to go wrong, below 603p would be an issue, calculating with the potential of coming reversals to an initial 580p with our secondary, if broken, a future 544p and a potential bounce.
Long story short, share price closure above 642p shall make this interesting.
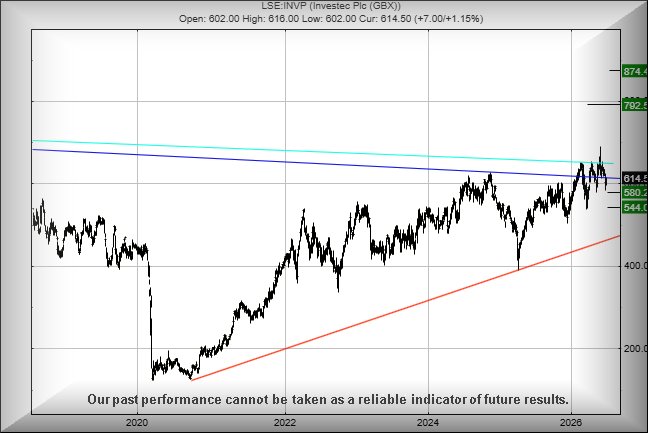
Source: Trends and Targets. Past performance is not a guide to future performance. Important: Trends and Targets charts only incorporate official share count consolidations, ignoring rights issues where investors have a choice as to whether to participate.
Alistair Strang has led high-profile and "top secret" software projects since the late 1970s and won the original John Logie Baird Award for inventors and innovators. After the financial crash, he wanted to know "how it worked" with a view to mimicking existing trading formulas and predicting what was coming next. His results speak for themselves as he continually refines the methodology.
Alistair Strang is a freelance contributor and not a direct employee of Interactive Investor. All correspondence is with Alistair Strang, who for these purposes is deemed a third-party supplier. Buying, selling and investing in shares is not without risk. Market and company movement will affect your performance and you may get back less than you invest. Neither Alistair Strang or Interactive Investor will be responsible for any losses that may be incurred as a result of following a trading idea.
These articles are provided for information purposes only. Occasionally, an opinion about whether to buy or sell a specific investment may be provided by third parties. The content is not intended to be a personal recommendation to buy or sell any financial instrument or product, or to adopt any investment strategy as it is not provided based on an assessment of your investing knowledge and experience, your financial situation or your investment objectives. The value of your investments, and the income derived from them, may go down as well as up. You may not get back all the money that you invest. The investments referred to in this article may not be suitable for all investors, and if in doubt, an investor should seek advice from a qualified investment adviser.
Full performance can be found on the company or index summary page on the interactive investor website. Simply click on the company's or index name highlighted in the article.