M&S half-year results: this unit is star of the show
Numbers continue to bear the scars of last year's cyber attack, but the business is back on track. ii's head of markets looks at the figures.
4th November 2026 08:32
by Richard Hunter from interactive investor
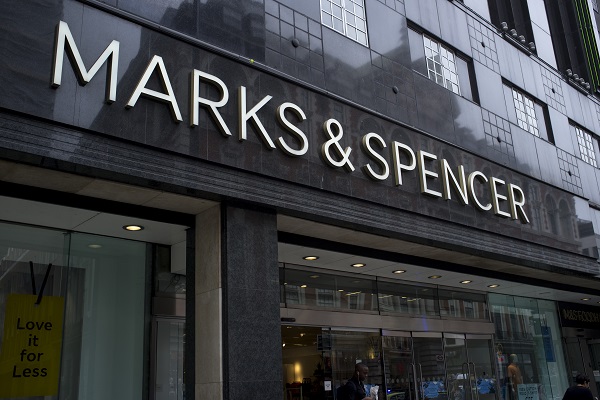
A small hangover from the cyber attack on Marks & Spencer Group (LSE:MKS) remains in the Fashion, Home and Beauty (FHB) business, but the Food unit continues its inexorable rise even before the impending festive season where the retailer traditionally prevails.
- Our Services: SIPP Account | Stocks & Shares ISA | See all Investment Accounts
In FHB, sales rose by 17.5% in the 26 weeks ended 26 September to £2 billion, as expected, but the number is 1.7% lower than two years ago, reflecting that the recovery is not quite complete. The hangover has been felt in the manual processes which hampered the availability of stock, although this is not expected to be a factor for the remainder of the year.
The excessive summer heat was another headwind which resulted in lower store sales. Even so, adjusted operating profit (AOP) of £150.5 million was significantly higher than last year on a healthy margin of 7.5%, as the group continues its store rotation and where online growth remains in evidence, up by 11.2% compared to two years ago.
- US midterm elections: one of best historical buy signals for equities
- 10 of the biggest IPOs on Wall Street in 2026
Of course, the threat to the business was never existential, but nonetheless had a significant impact on sales. It remains to be seen how much of the business lost during the disruption will be recovered, not least in FHB, which accounts for 22% of group revenues.
The online outage left a mark on the group’s reputation as well as inflicting some material damage. Adjusting items for last year totalled £292.1 million, including £131.3 million related solely to the attack, although M&S was able to recoup £100 million in its insurance claim. More positively, the company noted that sales were showing strong signs of resonating with shoppers, playing into its new target market of the “modern mainstream customer” as it attempts to throw off the shackles of a previously dowdy and tired image, including but not limited to both women’s and men’s categories.
Any slack is however overpowered by the ongoing resilience and strength of the Food business, which accounts for 56% of group revenues. Sales increased by 13.9% to £5.16 billion in the period (and by 23.1% compared to two years ago), where innovation and quality upgrades continue to propel performance.
Prospects remain bright for the unit, which is a clear focus of the group’s push for growth in terms of new stores and general investment. Indeed, quite apart from the enduring appeal of its specialist food ranges, the nature of these revamped stores has led to a noticeable increase in customers choosing M&S for their full shop, let alone the high hopes ahead of the festive season.
Strong volume growth and structural cost savings drove AOP to £288.6 million versus a previous £89.1 million, operating margin spiked to 5.6% from 2% and, over the course of this year, the Food business will benefit from £500 million of investment from the group, with the balance of £250 million going to FHB. Food margins are expected to move higher over the remainder of the year and the unit remains the jewel in the M&S crown by some distance.
Elsewhere, there was further progress in Ocado Retail, where sales grew by 20.6% to £1.78 billion (19% of the group total) and an AOP of £25.6 million compared with a loss of £3.1 million in the corresponding period. M&S remains committed to the venture, and the move to a profitable return marks an inflection point, even if reaching this stage has taken longer than initially hoped. The balance of the business is the International unit which, while accounting for just 3% of group sales, nonetheless posted an AOP of £15.3 million, underpinned by a 22.1% hike in revenue growth.
The headline numbers therefore looked extremely healthy compared to the previous year as expected, although the comparison to the period prior to the cyber attack is less punchy. Revenues for the half increased by 16.2% to £9.25 billion, and the adjusted pre-tax profit rose from £184.1 million to £403.2 million, ahead of the expected £390 million but slightly shy of the £413.1 million achieved two years prior.
- Wild’s Winter Portfolios 2026: winning stocks revealed
- Sign up to our free newsletter for investment ideas, latest news and award-winning analysis
The financial stability of the business has enabled a 16.7% increase to the dividend, although the projected yield of 1.1% is pedestrian, leaving investors to benefit instead from the share price performance.
That performance has been slightly tempered by the 2025 cyber attack, with a rise of 7% over the last 12 months comparing to a gain of 9.5% for the wider FTSE100. However, more recently the shares have seen renewed interest, with a spike of 26% in the year so far, and the price remains ahead by 86% over the last three years.
The initial reaction to the update has been neutral given the slight FHB overhang, but with the business clearly back on track the market consensus of the shares as a strong buy reflects investor optimism for the next chapter in restoring M&S to its former glories.
These articles are provided for information purposes only. Occasionally, an opinion about whether to buy or sell a specific investment may be provided by third parties. The content is not intended to be a personal recommendation to buy or sell any financial instrument or product, or to adopt any investment strategy as it is not provided based on an assessment of your investing knowledge and experience, your financial situation or your investment objectives. The value of your investments, and the income derived from them, may go down as well as up. You may not get back all the money that you invest. The investments referred to in this article may not be suitable for all investors, and if in doubt, an investor should seek advice from a qualified investment adviser.
Full performance can be found on the company or index summary page on the interactive investor website. Simply click on the company's or index name highlighted in the article.