The warning signs that a market crash is about to happen
24th August 2021 07:24
by Alistair Strang from Trends and Targets
There's talk of a crash, but US markets keep setting record highs. Independent chartist Alistair Strang reveals his own system that will warn of a significant sell-off.

Sometimes, there is a strange type of fatalistic attitude on the markets. An immediate example of this type of thinking relates to the S&P 500, the complaint being fairly straightforward: ‘It’s going up!’. Doubtless, the fact the index closed just 0.73 points below its prior high will now also be used as an excuse to manufacture fear in the marketplace. Just as there’s no rule which inhibits a price from falling below a certain level, equally there’s no rule dictating how high a price may go.
One of our favourite red flag statements relating to share prices is the classic, “the share price is absurdly cheap at such a level.”
Unfortunately, folk who believe the integrity of such generally find themselves walking funny, upon discovering their 100p share can quite cheerfully slip lower. However, sometimes trite analysis can have a pretty firm basis in logic. Apparently, the S&P has now experienced 201 sessions without experiencing a reversal of more than 5%, and the argument is being made that we should expect one.
- When markets fall, here’s what to avoid doing
- History suggests markets are heading for a correction
- Want to buy and sell international shares? It’s easy to do. Here’s how
At first glance, the chart below allows the pretence this could be right. We should all be looking nervously over our shoulders, but there is another reality. The previous longest stretch without a pullback of above 5% occurred in early 2018, when 404 sessions of growth elapsed before it all went a little bit wrong. Just because the index is currently at 201 sessions shouldn’t make people nervous.
But what makes us nervous has been the pace of climb since the Covid-19 crash in 2020. This US index has more than doubled in value since the pandemic low. Often, a relentless climb such as this risks being being wiped off the map in just a few sessions. This isn’t always true, Tesla Inc (NASDAQ:TSLA) being a case in point but, equally, cryptocurrency tends to repay sharp rises with remorseless falls.
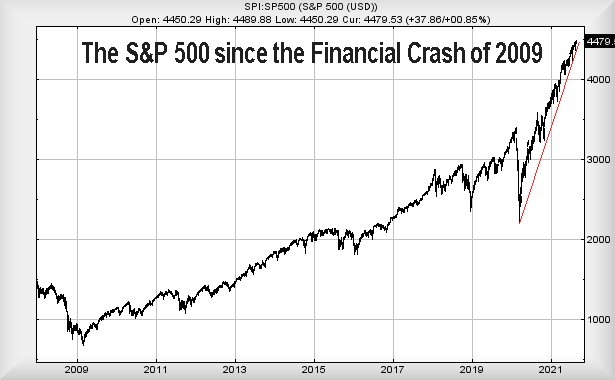
Source: Trends and Targets. Past performance is not a guide to future performance.
The warning signs
Our preferred attitude is to provide a reversal logic which is fairly tame, hopefully able to provide early warning of stormy times ahead should our drop targets start being broken.
In the case of the S&P, below 4,397 looks problematic, allowing reversal to an initial 4,279. If broken, our secondary works out at 4,220 points, a level where the visuals give some hope for a bounce. In fairness, this would also virtually match the 5% reversal expectation. Keeping with our habit of examining how bad things can really get, should the index close a session below 4,220 points, a pretty severe reversal path down to 3,633 eventually becomes arithmetically possible.
- Why reading charts can help you become a better investor
- Take control of your retirement planning with our award-winning, low-cost Personal Pension
Earlier, we said there is never a certainty of a ceiling or floor in the marketplace.
There’s a pretty cloudy argument making it extremely difficult to plot future upward potentials for the S&P. However, should the index next manage to trade above 4,490 points, we can currently provide a scenario where continued gains toward 4,597 are expected, with a seriously longer term influence exerted at an amazing 4,969 points!
Normally, we’d have trouble accepting such lofty ambitions but, since the pandemic hit, ‘normality’ has become a concept the markets no longer understand, if they ever did!
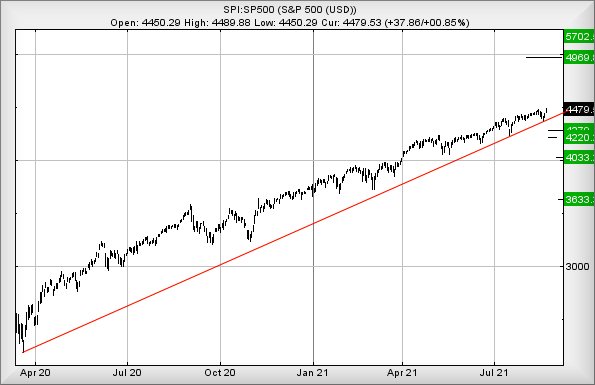
Source: Trends and Targets. Past performance is not a guide to future performance.
Alistair Strang has led high-profile and "top secret" software projects since the late 1970s and won the original John Logie Baird Award for inventors and innovators. After the financial crash, he wanted to know "how it worked" with a view to mimicking existing trading formulas and predicting what was coming next. His results speak for themselves as he continually refines the methodology.
Alistair Strang is a freelance contributor and not a direct employee of Interactive Investor. All correspondence is with Alistair Strang, who for these purposes is deemed a third-party supplier. Buying, selling and investing in shares is not without risk. Market and company movement will affect your performance and you may get back less than you invest. Neither Alistair Strang or Interactive Investor will be responsible for any losses that may be incurred as a result of following a trading idea.
These articles are provided for information purposes only. Occasionally, an opinion about whether to buy or sell a specific investment may be provided by third parties. The content is not intended to be a personal recommendation to buy or sell any financial instrument or product, or to adopt any investment strategy as it is not provided based on an assessment of your investing knowledge and experience, your financial situation or your investment objectives. The value of your investments, and the income derived from them, may go down as well as up. You may not get back all the money that you invest. The investments referred to in this article may not be suitable for all investors, and if in doubt, an investor should seek advice from a qualified investment adviser.
Full performance can be found on the company or index summary page on the interactive investor website. Simply click on the company's or index name highlighted in the article.