Why reading charts can help you become a better investor
We explain in simple terms why charts are analysed in dealing rooms of investment banks the world over.
14th September 2020 14:42
by Nicole Elliott from interactive investor
Charting expert Nicole Elliott explains in simple terms why charts are analysed in dealing rooms of investment banks the world over, and why understanding their importance can help us all make better investment decisions.

Because you don’t know something, it doesn’t mean it is difficult. With that thought front and centre, and having ditched biases and old baggage, carry on reading this introductory article to get to grips with the basics of technical analysis.
When I was first taught the subject it was called chart analysis, or charting. The “technical” was added later, and I can only imagine someone thought the “whizz-bang” word would attract a younger generation. The subject has precious little to do with science or technology – other than we use laptops to track prices – so no need to be afraid.
Technical analysis is believed to be one of the oldest methods of assessing financial instruments, having first been used in the wholesale rice markets of early 18th-century Japan. Using pencil and white paper, a note was made of the daily opening price, highest and lowest prices of the day, and the last traded price before the market closed for the night.
Note: only traded prices were plotted – bids and offers were ignored as these are not necessarily representative of the equilibrium between supply and demand. Price is plotted on the vertical axis of the chart, and time – usually daily intervals – along the horizontal. It is very visual, and very different to the lists of prices you may have come across in the business pages of your favourite newspaper.
For some, the snapshot serves only as an aide-memoire, a reminder of say where we were trading a week, a month, or a year ago. You’ll see this in practice in many articles and on trading desks, its most classic examples being economic statistics such as inflation, unemployment or economic growth. A technical analyst takes the chart one step further and seeks out trends, signs of a market turn, euphoria and distress; this is where the forecasting starts.
Why technical analysis works
It works because the underlying assumption is that all possible information on a freely-traded financial instrument like shares, commodities such as gold, silver and oil, or currencies, is “in the price”. This means that all the knowns, unknowns, hopes and plans reflect the current attitude of investors to this instrument and how much they are willing to buy or sell it for.
Often, you will see share prices dip but rarely drop much below a certain price. This could quite probably be because an influential investor such as a private equity firm, or pension fund, has made an executive decision to acquire stock in the company at a price it thinks is good value. It will wait for the price to drop to that level before buying. Likewise, prices sometimes rally but seem to hit a brick wall at a particular level. This can often be due to selling by parties who are happy to bank a profit at that price in the belief that the shares might not go much higher. They might possibly sell multiple times if they own lots of stock.
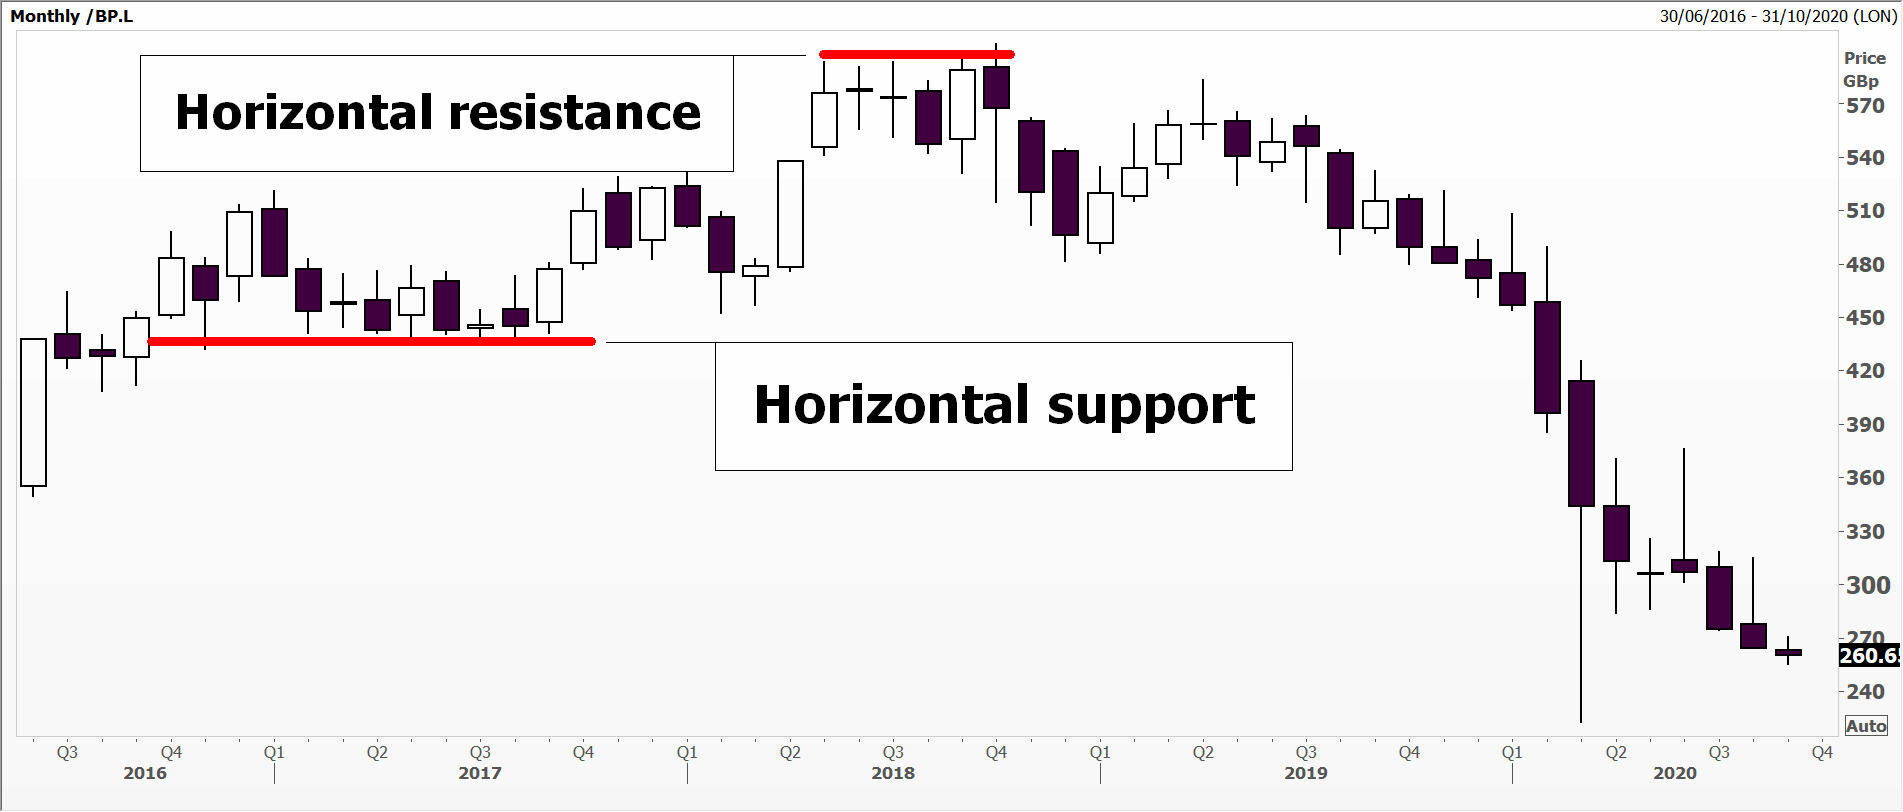
Source: Thomson Reuters Eikon. BP Plc, monthly candlestick chart Past performance is not a guide to future performance
Above is a monthly candlestick chart of the price of shares in the oil company BP (LSE:BP.) between late 2016 and September 2020. The white candles tell us when the market closed higher than where it opened; the black ones when the share price dropped below the opening price over the month.
On the far left of the chart, you will see that BP shares bounced a little every time the share price dipped to the 440p area. This is known as horizontal support. In this instance, the average price stood at 460p for 12 months. Look at the top of the chart and you will see an example of horizontal resistance. In this example, lots of shareholders wanted to sell BP shares at around 580p over a period of months. During this time, the price failed to stay above that level for any length of time due to this persistent selling pressure. We'll discuss why certain prices become important in future articles.
When to use the charts
Some investors will use only charts to make their trades, but many find that technical analysis complements more traditional fundamental analysis, which involves examining company balance sheets and considering economic events and their impact on the business. In this case, charts are used as a guide to when a share price might meet resistance on the way up or find support if the price is falling. This can help you decide when to time your trades.
I will be talking about support and resistance levels, candlesticks, moving averages, “chart breakouts” and more in greater depth in future articles.
Using charts to predict future price movement is valid not just for stocks, but also bonds, currencies and commodities. The most important thing for it to work is that there is an even playing field, and that everyone can see accurate and reliable data. For this reason, investments such as real estate do not lend themselves to technical analysis as the market is too diversified, so too antiques and second-tier artworks.
Different approaches to charting
Like other academic fields, there are various schools of thought in technical analysis. I’m very much at the visual end of the spectrum, looking for patterns that repeat themselves and market trends that I can latch on to.
Others such as “Tramline Trader”John Burford (who writes the popular Chart of the Week column for interactive investor) looks perhaps in more detail at the smaller signs in the market. Conversely, IT whizz Alistair Strang at Trends and Targets, who you can also read at ii, has a strong focus on software and artificial intelligence.
If you’re still wondering whether picking up the subject is worth your while, what if I told you that today, in the dealing rooms of most investment banks, technical analysis, or charting, is used constantly.
The first to cotton on were the foreign exchange traders. The biggest, fastest-moving market in the world found that economic data was just so old hat. What’s the point of waiting for a central bank decision or quarterly GDP data when we’ve been constantly asked to make two-way prices – both a price at which you are prepared to buy from others and one to sell to them– for the previous three months?
Bond traders also realised that the charts could give them an inkling as to whether a new issue of bonds would be well-received or was, potentially, a flop.
Western stock brokers have been using charts for more than a century. A pillar of the community was Charles Dow, editor of TheWall Street Journal and inventor of the Dow Jones stock indices. He pulled together and published a compendium of the thinking at the time (circa 1900), pooling ideas from contemporaries and contributors to the newspaper. This became known as Classic Dow Theory, the bedrock of today’s thinking. From there, others have added bells and whistles, many of which we will introduce you to shortly.
Nicole Elliott is a freelance contributor and not a direct employee of interactive investor.
A graduate of the London School of Economics and Political Science (BSc social psychology), Nicole Elliott has worked in banks in the City of London for the last 30 years. Whether in sales, trading or forecasting, technical analysis has always been the bedrock of her thinking. Her key expertise lies within all areas of Treasury: foreign exchange, money markets, fixed income and commodities. She has also added to the body of knowledge of the industry, writing the first Western book on Ichimoku Cloud Charts. Strong media links and a cult following are due to her prescient calls on the markets and often entertaining format.
These articles are provided for information purposes only. Occasionally, an opinion about whether to buy or sell a specific investment may be provided by third parties. The content is not intended to be a personal recommendation to buy or sell any financial instrument or product, or to adopt any investment strategy as it is not provided based on an assessment of your investing knowledge and experience, your financial situation or your investment objectives. The value of your investments, and the income derived from them, may go down as well as up. You may not get back all the money that you invest. The investments referred to in this article may not be suitable for all investors, and if in doubt, an investor should seek advice from a qualified investment adviser.
Full performance can be found on the company or index summary page on the interactive investor website. Simply click on the company's or index name highlighted in the article.