Is a chart breakout on the horizon at IAG?
Independent analyst Alistair Strang studies the possible outcomes for the British Airways owner and gives away a trading secret.
27th October 2026 07:25
by Alistair Strang from Trends and Targets

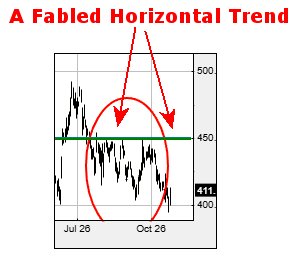
There are absolutely no indicators that can guarantee a share price will move in a particular direction, but a handful are well worth watching closely. At present, International Consolidated Airlines Group SA (LSE:IAG) is producing one of our favourites; what we call a horizontal trend, or glass ceiling.
- Invest with ii:Open a Stocks & Shares ISA | Top ISA Funds | Transfer your ISA to ii
The pattern is relatively straightforward. Price action converges around a horizontal resistance level, creating a ceiling that the share price must overcome before a potentially significant move can develop. The sensible approach is to wait for confirmation rather than anticipate the breakout.
In IAG’s case, that means watching for a closing price above 446p, the highest relevant closing level along our marked resistance line. A sustained break above this threshold could provide the catalyst for a more meaningful upward move. We have drawn our green line at 450p, but the technical distinction matters. A close above 446p would provide one form of confirmation, while an intraday move above the previous high would offer an alternative signal.
Another approach is to wait for the share price to exceed the highest intraday trading level within the pattern. For IAG, that points to the high recorded on 27 July at approximately 455p.
Naturally, waiting for the higher confirmation level could eat into potential profits. Nevertheless, both breakout scenarios suggest an initial target around 488p, leaving a potentially worthwhile move for the observant and suitably risk-aware trader.
Source: Trends and Targets. Past performance is not a guide to future performance.
Why horizontal trends deserve attention
We often point out that a trend break, in isolation, is rarely a reliable indication of future gains or losses. Horizontal trends, however, have historically been an exception that we believe deserves particular attention.
The reverse pattern is equally important. When a series of successive highs creates a glass ceiling, a series of corresponding lows can form what we call a glass floor. If that floor eventually breaks, the resulting downward move can be both sharp and pronounced.
For now, though, the balance of the technical evidence suggests that IAG may be harbouring some upward ambitions.
IAG: the bullish and bearish scenarios
There are two principal scenarios to monitor, with clearly defined price levels for each.
The bearish scenario
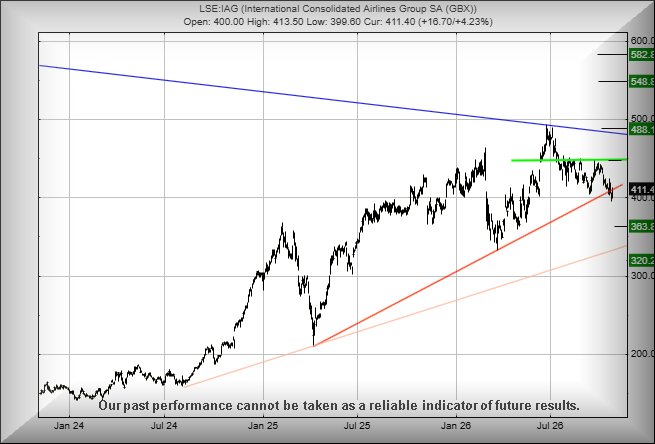
A move below 394p would threaten a reversal towards an initial downside target of 363p. If that level also fails to hold, our secondary projection points towards 320p.
For a trade based on this downside scenario, a stop-loss around 414p appears to be the tighter option, subject to the trader’s entry price, risk tolerance and execution strategy.
The bullish scenario
A move above 414p looks more interesting from the upside perspective. If momentum develops, our initial target sits at 447p. A break beyond that level would bring the secondary target of 488p into focus, potentially taking the share price into the zone associated with the horizontal trend breakout.
Beyond that, a further advance could put 548p on the radar as a longer-term secondary objective.
Of course, these levels are technical projections rather than guaranteed destinations. Confirmation, market conditions and the price action around each threshold will determine whether the anticipated moves develop.
Source: Trends and Targets. Past performance is not a guide to future performance.
Alistair Strang has led high-profile and "top secret" software projects since the late 1970s and won the original John Logie Baird Award for inventors and innovators. After the financial crash, he wanted to know "how it worked" with a view to mimicking existing trading formulas and predicting what was coming next. His results speak for themselves as he continually refines the methodology.
Alistair Strang is a freelance contributor and not a direct employee of Interactive Investor. All correspondence is with Alistair Strang, who for these purposes is deemed a third-party supplier. Buying, selling and investing in shares is not without risk. Market and company movement will affect your performance and you may get back less than you invest. Neither Alistair Strang or Interactive Investor will be responsible for any losses that may be incurred as a result of following a trading idea.
These articles are provided for information purposes only. Occasionally, an opinion about whether to buy or sell a specific investment may be provided by third parties. The content is not intended to be a personal recommendation to buy or sell any financial instrument or product, or to adopt any investment strategy as it is not provided based on an assessment of your investing knowledge and experience, your financial situation or your investment objectives. The value of your investments, and the income derived from them, may go down as well as up. You may not get back all the money that you invest. The investments referred to in this article may not be suitable for all investors, and if in doubt, an investor should seek advice from a qualified investment adviser.
Full performance can be found on the company or index summary page on the interactive investor website. Simply click on the company's or index name highlighted in the article.